Please click on the place names below for relevant charts and tables.

Highest Level of Education by Ethnic Group,
people aged 25+ in Aberdeen City, Census 2022
| Ethnic Group | No Quals | School Quals* | Apprentice-ship | Further or sub-degree Higher Education | Degree or Above | Total (aged 25+) |
|---|---|---|---|---|---|---|
| White Scot/Brit | 16% 20,222 | 28% 35,249 | 9% 11,456 | 12% 15,188 | 34% 42,409 | 124,524 (78%) |
| White Other | 8% 1,321 | 20% 3,434 | 3% 466 | 14% 2,358 | 55% 9,381 | 16,960 (11%) |
| Mixed or Multiple | 6% 89 | 17% 256 | 3% 40 | 10% 156 | 65% 985 | 1,526 (1%) |
| Asian | 9% 734 | 13% 1,058 | 1% 88 | 7% 537 | 70% 5,669 | 8,086 (5%) |
| African | 2% 91 | 6% 305 | 1% 34 | 6% 315 | 85% 4,369 | 5,114 (3%) |
| Caribbean or Black | 8% 30 | 20% 71 | 3% 9 | 12% 44 | 57% 205 | 359 (0.2%) |
| Other | 8% 186 | 10% 224 | 2% 48 | 7% 150 | 72% 1,592 | 2,200 (1.4%) |
| Total (aged 25+) | 14% 22,673 | 26% 40,597 | 8% 12,141 | 12% 18,748 | 41% 64,610 | 158,769 |

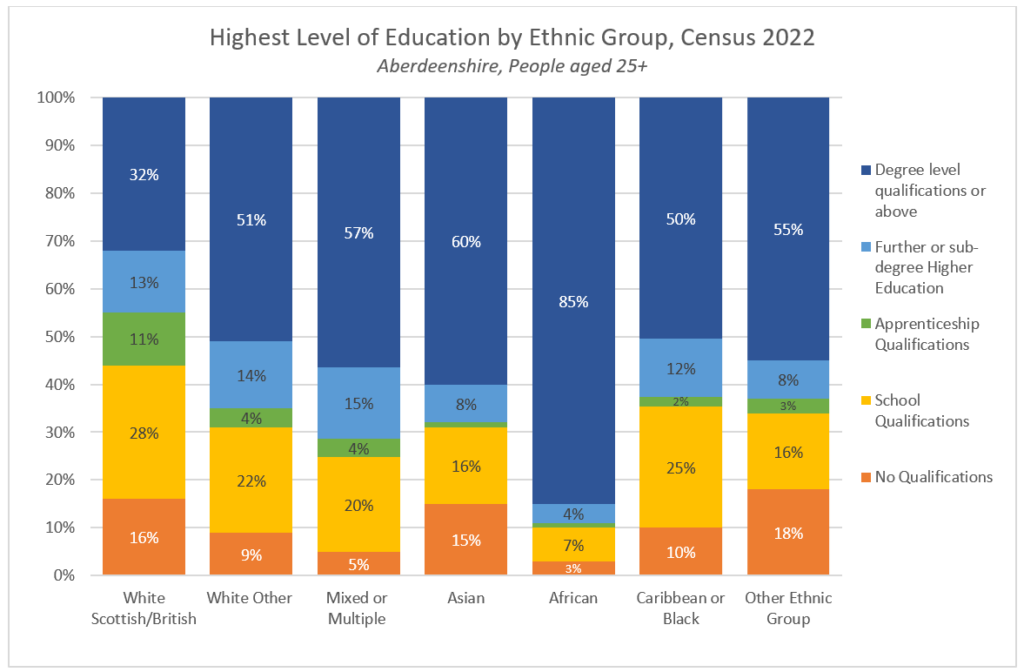
Highest Level of Education by Ethnic Group,
people aged 25+ in Aberdeenshire, Census 2022
| Ethnic Group | No Quals | School Quals* | Apprentice-ship | Further or sub-degree Higher Education | Degree or Above | Total (aged 25+) |
|---|---|---|---|---|---|---|
| White Scot/Brit | 16% 28,610 | 28% 50,854 | 11% 19,388 | 13% 23,892 | 32% 56,760 | 179,504 (93%) |
| White Other | 9% 911 | 22% 2,164 | 4% 341 | 14% 1,329 | 51% 4,882 | 9,627 (5%) |
| Mixed or Multiple | 5% 43 | 20% 157 | 4% 29 | 15% 120 | 57% 456 | 805 (0.4%) |
| Asian | 15% 288 | 16% 316 | 1% 26 | 8% 158 | 60% 1,171 | 1,959 (1%) |
| African | 3% 20 | 7% 46 | 1% 9 | 4% 29 | 85% 580 | 684 (0.4%) |
| Caribbean or Black | 10% 18 | 25% 45 | 2% 4 | 12% 22 | 50% 90 | 179 (0.1%) |
| Other | 18% 140 | 16% 125 | 3% 24 | 8% 59 | 55% 422 | 770 (0.4%) |
| Total (aged 25+) | 16% 30,030 | 28% 53,707 | 10% 19,821 | 13% 25,609 | 33% 64,361 | 193,528 |

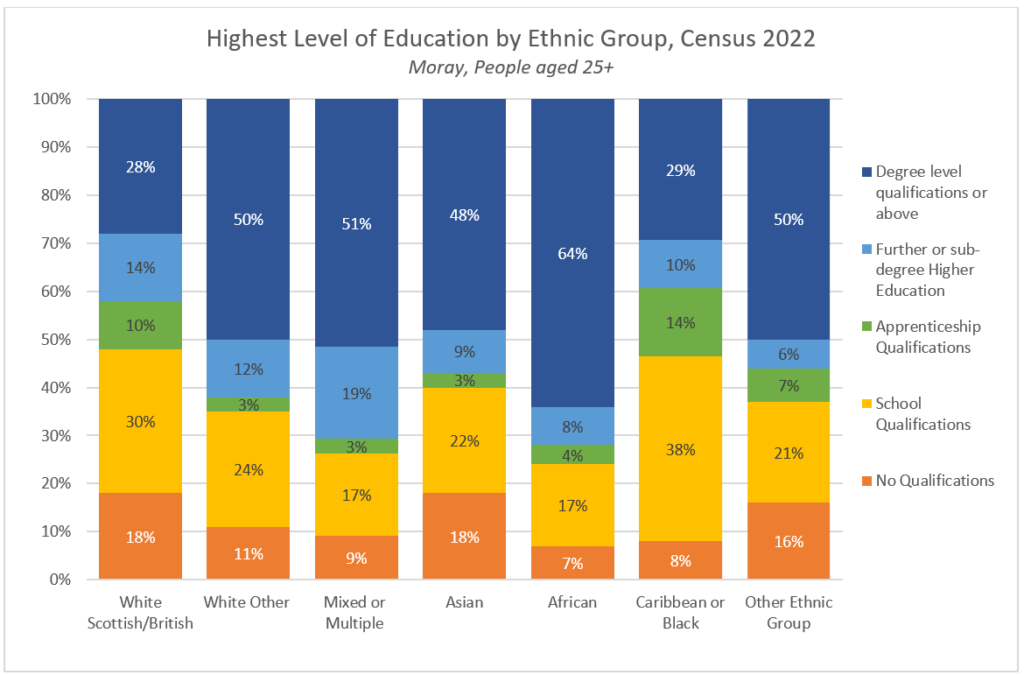
Highest Level of Education by Ethnic Group,
people aged 25+ in Moray, Census 2022
| Ethnic Group | No Quals | School Quals* | Apprentice-ship | Further or sub-degree Higher Education | Degree or Above | Total (aged 25+) |
|---|---|---|---|---|---|---|
| White Scot/Brit | 18% 11,895 | 30% 19,731 | 10% 6,855 | 14% 8,980 | 28% 18,057 | 65,518 (94%) |
| White Other | 11% 289 | 24% 645 | 3% 88 | 12% 332 | 50% 1,336 | 2,690 (4%) |
| Mixed or Multiple | 9% 27 | 17% 51 | 3% 9 | 19% 57 | 51% 150 | 294 (0.4%) |
| Asian | 18% 110 | 22% 129 | 3% 16 | 9% 52 | 48% 288 | 595 (0.9%) |
| African | 7% 7 | 17% 18 | 4% 4 | 8% 8 | 64% 66 | 103 (0.1%) |
| Caribbean or Black | 8% 6 | 38% 30 | 14% 11 | 10% 8 | 29% 23 | 78 (0.1%) |
| Other | 16% 38 | 21% 49 | 7% 17 | 6% 14 | 50% 119 | 237 (0.3%) |
| Total (aged 25+) | 18% 12,372 | 30% 20,653 | 10% 7,000 | 14% 9,451 | 29% 20,039 | 69,515 |

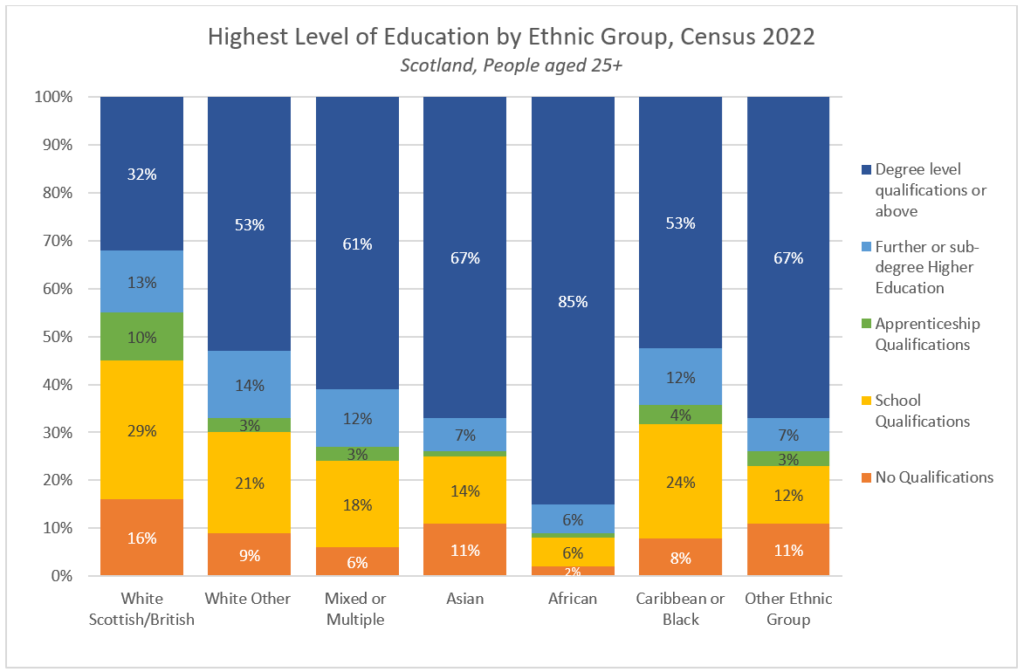
Highest Level of Education by Ethnic Group,
people aged 25+ in Scotland, Census 2022
| Ethnic Group | No Quals | School Quals* | Apprentice-ship | Further or sub-degree Higher Education | Degree or Above | Total (aged 25+) |
|---|---|---|---|---|---|---|
| White Scot/Brit | 16% 60,721 | 29% 105,835 | 10% 37,698 | 13% 48,066 | 32% 117,235 | 369,555 (88%) |
| White Other | 9% 2,521 | 21% 6,245 | 3% 896 | 14% 4,019 | 53% 15,599 | 29,280 (7%) |
| Mixed or Multiple | 6% 155 | 18% 469 | 3% 80 | 12% 325 | 61% 1,594 | 2,623 (0.6%) |
| Asian | 11% 1,133 | 14% 1,507 | 1% 132 | 7% 749 | 67% 7,121 | 10,642 (3%) |
| African | 2% 115 | 6% 362 | 1% 45 | 6% 350 | 85% 5,016 | 5,888 (1.4%) |
| Caribbean or Black | 8% 48 | 24% 144 | 4% 22 | 12% 72 | 53% 325 | 611 (0.1%) |
| Other | 11% 363 | 12% 392 | 3% 90 | 7% 221 | 67% 2,125 | 3,191 (0.8%) |
| Total (aged 25+) | 15% 65,056 | 27% 114,954 | 9% 38,963 | 13% 53,802 | 35% 149,015 | 421,790 |
Please note, headline statistics on people’s levels of education typically relate to those aged 16 and older, even though most apprenticeships, further education courses and degrees are not completed until age 18-22. The next age range available for figures on education and ethnicity begins with age 25. Therefore, the figures above were calculated excluding the 16-24 age range. To see the data for age 16+, please click here.
Data Source: 2022, Census tables UV501 and UV201b. Link.
