Please click on the place names below for relevant charts and tables.
Highest Level of Education by Ethnic Group,
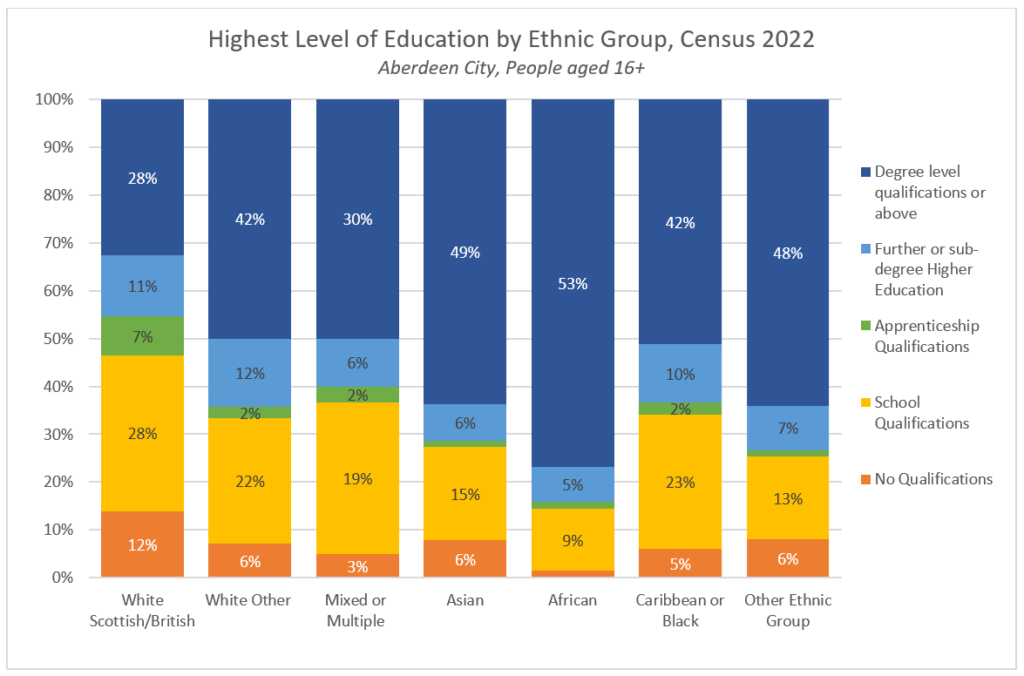
people aged 16+ in Aberdeen City, Census 2022
| Ethnic Group | No Quals | School Quals* | Apprentice-ship | Further or sub-degree Higher Education | Degree or Above | Total (aged 16+) |
|---|---|---|---|---|---|---|
| White Scot/Brit | 12% 21,006 | 28% 46,868 | 7% 12,331 | 11% 18,735 | 28% 46,940 | 145,880 |
| White Other | 6% 1,438 | 22% 5,657 | 2% 530 | 12% 3,091 | 42% 10,680 | 21,396 |
| Mixed or Multiple | 3% 107 | 19% 751 | 2% 61 | 6% 244 | 30% 1,185 | 2,348 |
| Asian | 6% 765 | 15% 1,905 | 1% 106 | 6% 745 | 49% 6,428 | 9,949 |
| African | 1% 102 | 9% 776 | 1% 50 | 5% 429 | 53% 4,744 | 6,101 |
| Caribbean or Black | 5% 26 | 23% 126 | 2% 9 | 10% 55 | 42% 230 | 446 |
| Other | 6% 212 | 13% 477 | 1% 52 | 7% 236 | 48% 1,730 | 2,707 |
| Total | 11% 23,657 | 25% 56,553 | 6% 13,139 | 11% 23,538 | 32% 71,942 | 188,827 |
Highest Level of Education by Ethnic Group,
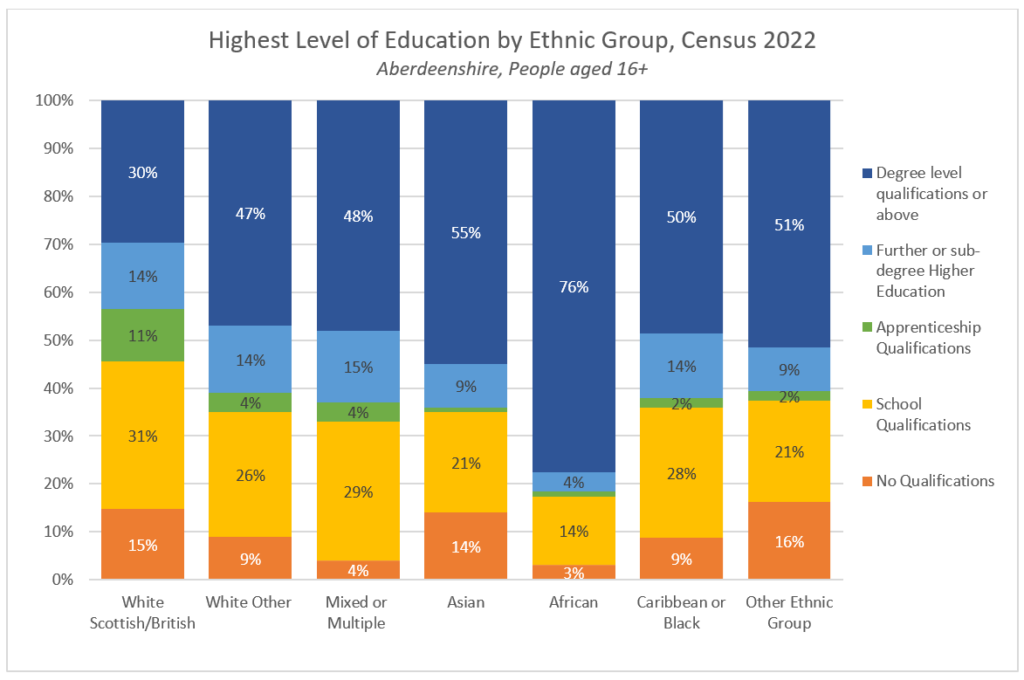
people aged 16+ in Aberdeenshire, Census 2022
| Ethnic Group | No Quals | School Quals* | Apprentice-ship | Further or sub-degree Higher Education | Degree or Above | Total (aged 16+) |
|---|---|---|---|---|---|---|
| White Scot/Brit | 15% 29,867 | 31% 62,145 | 11% 21,014 | 14% 27,192 | 30% 59,023 | 199,241 |
| White Other | 9% 986 | 26% 2,755 | 4% 407 | 14% 1,509 | 47% 5,030 | 10,687 |
| Mixed or Multiple | 4% 45 | 29% 302 | 4% 40 | 15% 155 | 48% 491 | 1,033 |
| Asian | 14% 302 | 21% 449 | 1% 30 | 9% 198 | 55% 1,205 | 2,184 |
| African | 3% 28 | 14% 114 | 1% 11 | 4% 35 | 76% 609 | 797 |
| Caribbean or Black | 9% 17 | 28% 56 | 2% 4 | 14% 27 | 50% 99 | 203 |
| Other | 16% 143 | 21% 183 | 2% 19 | 9% 83 | 51% 446 | 874 |
| Total | 15% 31,388 | 31% 66,003 | 10% 21,531 | 14% 29,199 | 31% 66,900 | 215,024 |
Highest Level of Education by Ethnic Group,
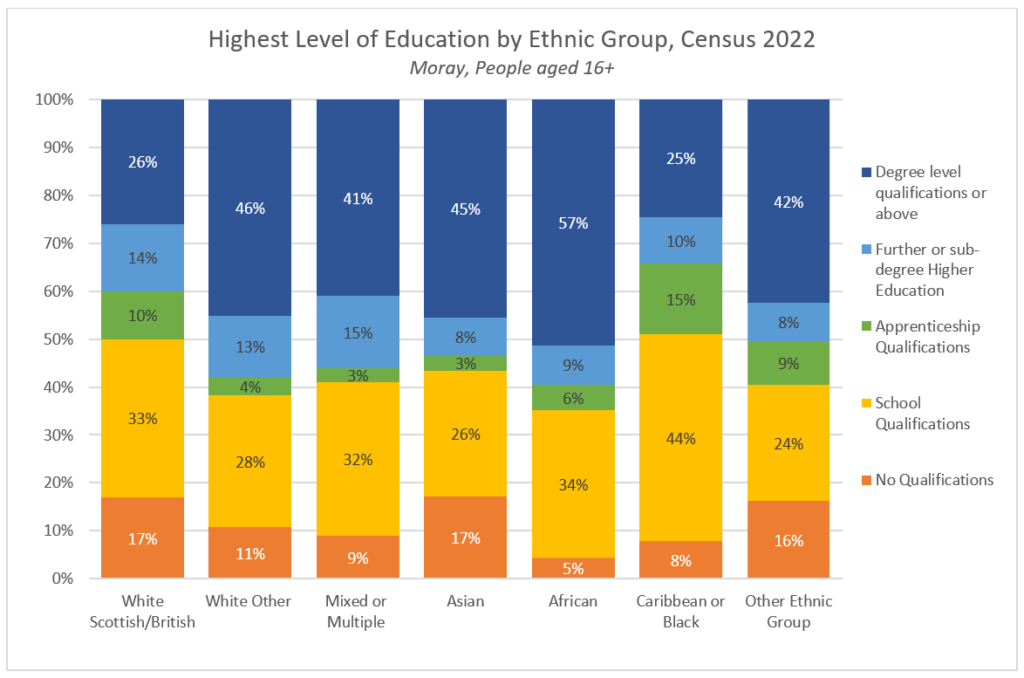
people aged 16+ in Moray, Census 2022
| Ethnic Group | No Quals | School Quals* | Apprentice-ship | Further or sub-degree Higher Education | Degree or Above | Total (aged 16+) |
|---|---|---|---|---|---|---|
| White Scot/Brit | 17% 12,443 | 33% 24,085 | 10% 7,576 | 14% 10,139 | 26% 18,850 | 73,093 |
| White Other | 11% 327 | 28% 844 | 4% 109 | 13% 380 | 46% 1,383 | 3,043 |
| Mixed or Multiple | 9% 36 | 32% 133 | 3% 13 | 15% 61 | 41% 167 | 410 |
| Asian | 17% 125 | 26% 186 | 3% 23 | 8% 60 | 45% 320 | 714 |
| African | 5% 6 | 34% 37 | 6% 7 | 9% 10 | 57% 63 | 123 |
| Caribbean or Black | 8% 8 | 44% 42 | 15% 14 | 10% 10 | 25% 24 | 98 |
| Other ethnic group | 16% 45 | 24% 65 | 9% 26 | 8% 22 | 42% 117 | 275 |
| Total | 17% 12,993 | 33% 25,393 | 10% 7,762 | 14% 10,680 | 27% 20,922 | 77,750 |
Highest Level of Education by Ethnic Group,
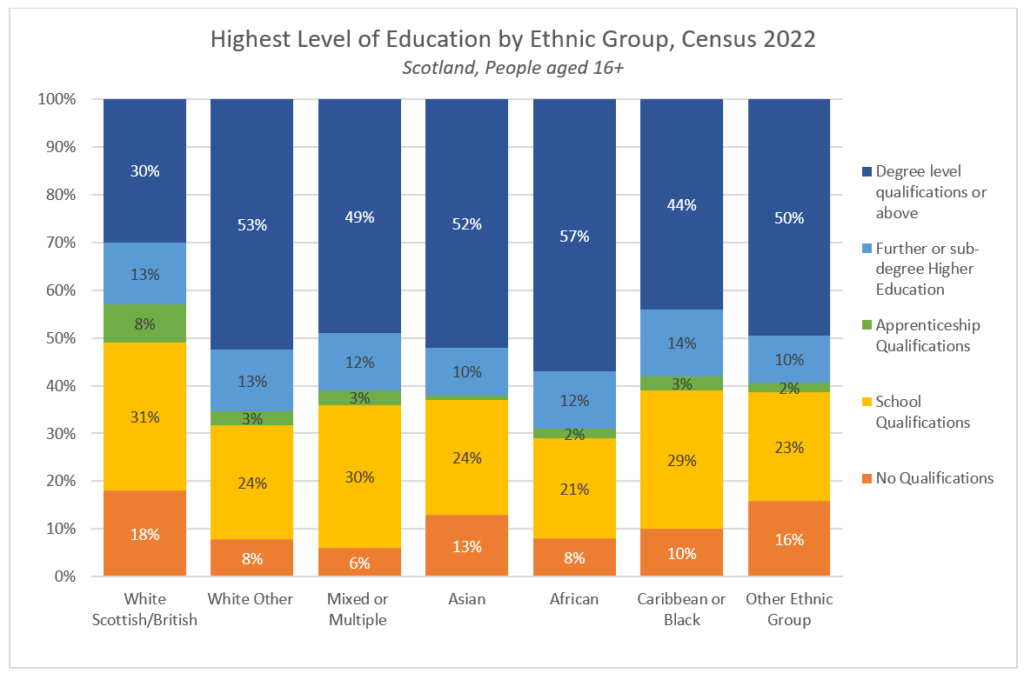
people aged 16+ in Scotland, Census 2022
| Ethnic Group | No Quals | School Quals* | Apprentice-ship | Further or sub-degree Higher Education | Degree or Above | Total (aged 16+) |
|---|---|---|---|---|---|---|
| White Scot/Brit | 18% 701,367 | 31% 1,231,402 | 8% 335,694 | 13% 538,325 | 30% 1,186,726 | 3,993,514 |
| White Other | 8% 22,000 | 24% 64,809 | 3% 7,399 | 13% 34,255 | 53% 144,021 | 272,484 |
| Mixed or Multiple | 6% 2,131 | 30% 10,940 | 3% 906 | 12% 4,502 | 49% 17,537 | 36,016 |
| Asian | 13% 21,979 | 24% 38,953 | 1% 2,105 | 10% 15,548 | 52% 84,550 | 163,135 |
| African | 8% 3,345 | 21% 8,362 | 2% 753 | 12% 4,829 | 57% 22,922 | 40,211 |
| Caribbean or Black | 10% 532 | 29% 1,590 | 3% 187 | 14% 796 | 44% 2,416 | 5,521 |
| Other ethnic group | 16% 6,057 | 23% 8,486 | 2% 722 | 10% 3,759 | 50% 18,681 | 37,705 |
| Total | 17% 757,417 | 30% 1,364,545 | 8% 347,762 | 13% 602,020 | 32% 1,476,851 | 4,548,589 |
Please note, the figures above are for all people aged 16 or older. If the cut-off age was 22 (for example), the proportion of people with qualifications would be slightly higher, because many apprenticeships, further education courses and degrees are not completed until age 18-22. However, as people aged 16-18 make up 3% of the population across Scotland, or 8% for age 16-22 (see Table UV102a), the maximum difference is likely to be only a few percentage points.
Data Source: 2022, Census tables UV501 and UV201b. Link.