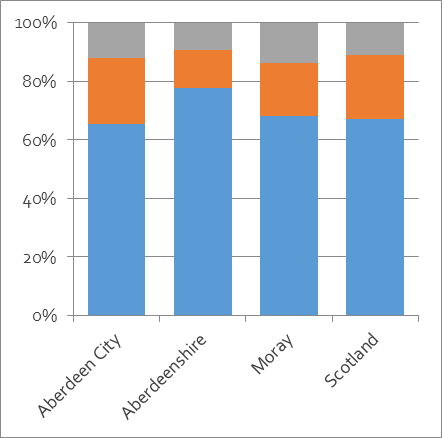
Similar to the pattern across Scotland, ethnic minorities in Grampian lived with less secure tenure than Scottish/British people. On average, four times more ethnic minority people rent from private landlords than Scottish/British people, and even in Aberdeenshire, where home ownership is highest, less than half of ethnic minority people own their homes, compared with more than three-quarters of Scottish/British people.
This may be partly a function of the age and employment profile of the ethnic minority population, who are on average younger and working in more precarious jobs than their Scottish/British counterparts. Links between age, ethnicity, employment and housing will be fruitful topic to explore when the 2022 census data is released.
Tenancy by Ethnicity, 2011 Census
| Ethnicity | Abdn City | Abdn shire | Moray | Grampian | Scotland | |
| Owner-Occupied | Scottish/British | 66% | 77% | 69% | 70% | 67% |
| Owner-Occupied | Ethnic Minority | 30% | 46% | 40% | 39% | 45% |
| – | – | – | – | – | – | – |
| Social Rented | Scottish/British | 23% | 13% | 18% | 18% | 22% |
| Social Rented | Ethnic Minority | 20% | 14% | 12% | 15% | 18% |
| – | – | – | – | – | – | – |
| Private Rented | Scottish/British | 12% | 9% | 14% | 12% | 11% |
| Private Rented | Ethnic Minority | 50% | 40% | 48% | 46% | 37% |
Scottish/British
Ethnic Minority
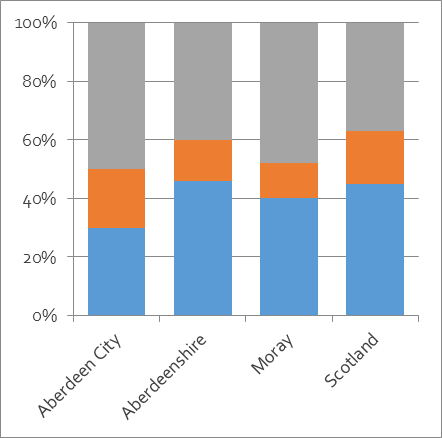
Note: ‘Ethnic minority’ includes all non-‘white’ ethnic groups, plus White Irish, White Gypsy/Traveller, White Polish and White Other.
Data Source: 2011, Scotland’s Census 2011, Table DC4214SCca.