The following research is summarised below:
- ‘Life in Aberdeen’ and ‘Life in Aberdeenshire’ Surveys, 2018
- Tackling Economic Barriers pilot study, 2017
- ‘Creating a Fairer and More Equal Aberdeen,’ 2016-17
351 people took part in the 2018 research, of whom 105 were ethnic minorities (29.6%), including several who completed the surveys in Polish. 197 participants were Scottish, English or British, 29 participants skipped the question on ethnicity, while 19 identified themselves only as ‘white’. 65 people took part in the 2017 pilot survey, which was targeted at ethnic minorities, and only one participant was Scottish. For the 2016-17 research, 225 people took part in a survey in the second half of 2016, mostly at ten community engagement events with groups representing seven of the equalities characteristics (race/ethnicity, religion/belief, age, disability, sex, sexual orientation, gender reassignment). 120 participants were Scottish or British, 84 were ethnic minorities, and 18 did not provide a useable answer.
Opinions of Aberdeen/shire
In the 2018 research, 81.9% of ethnic minority participants felt that Aberdeen or Aberdeenshire was a welcoming place, and 70.5% felt part of their communities. The figures for Scottish/British participants were 66.5% and 58.4%.
There were similar findings in the 2016-17 research: just over half of both Scottish/British and ethnic minority participants said they were active in their local communities, and around 90% said they feel able to participate in public life. 76.9% of ethnic minority participants felt that equality and diversity are welcomed and celebrated in Aberdeen, compared with 63.6% of Scottish/British participants.
In the 2017 pilot study, 83.1% of participants agreed that their neighbourhoods were welcoming places, 78.5% felt part of the communities where they lived, and 56.9% said they were active in their local communities.
Relations Between Groups
In the 2018 research, around three-quarters of Scottish/British participants felt that ethnic minorities are treated with respect, while a third of those from ethnic minority backgrounds disagreed with this statement. Three-quarters of both Scottish/British and ethnic minority participants agreed that people from different nationalities get along well in their local area.
In the 2016-17 research, 46% of Scottish/British participants and 55.4% of ethnic minority participants felt there are good relations between communities. Feedback urged Aberdeen City Council to organise more multicultural events, along with events highlighting the cultures and experiences of migrants, to further improve relations.
Use of Local Facilities
In the 2016-17 research, 60.3% of Scottish/British participants and 70.8% of ethnic minority participants said they used the city’s cultural and sporting facilities. In 2018, the frequency of using some community facilities was similar between Scottish/British and ethnic minority participants; nearly all used local shops and a health centre or GP, three quarters used local parks, and around half used a gym or swimming pool. Ethnic minorities made more use of libraries (64% versus 39%), schools or nurseries (54% versus 27%), community centres (53% versus 35%), places of worship or religion (30% versus 16%), and advice services (13% versus 8%). Scottish/British people were more likely to use local pubs or restaurants (82% versus 57%), and slightly more likely to use buses (75% versus 67%). For both groups, those who felt part of their communities tended to use more community facilities.
Involvement in Local Groups
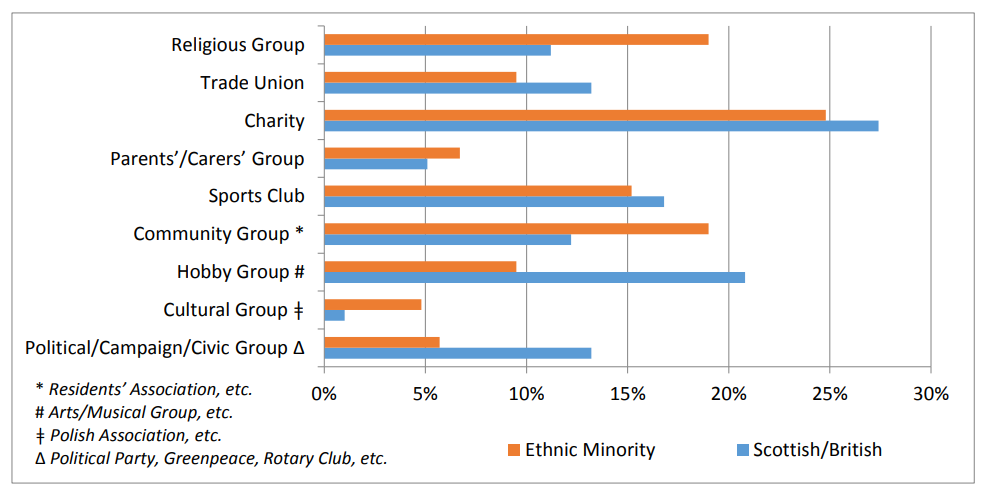
There were similar levels of involvement in local groups between ethnic minority and Scottish/British participants – just under 70% were involved in at least one group. As shown in the chart below, charities were the top groups, followed by religious, community and sport groups for ethnic minorities, and hobby and sport groups, political/campaign/civic groups, and trade unions for Scottish/British participants.
Involvement in Local Groups in Aberdeen/shire, by Ethnicity
Friendships
As with other areas, there were similar patterns between ethnic minority and Scottish/British participants here. In the 2018 research, the largest proportion of both groups met their friends at work – two-thirds for ethnic minorities, and nearly 80% for Scottish/British participants. Around half of both groups found friends at school, college or university, or through other friends, or through their children or other family members. Around 30% of both groups were friends with their neighbours, and around 10% met friends online. Half of Scottish/British participants met their friends through hobbies, sports, cultural groups, pets, or other types of groups, and this was the case for a third of ethnic minority participants. 19% of ethnic minority participants met their friends through religious groups, compared with 7.6% of Scottish/British participants.
A large majority of both ethnic minority and Scottish/British participants had friends who were different nationalities – 89.5% and 80.2%, respectively. A slightly smaller proportion had friends who spoke a different first language: 87.6% and 71.1%. In the 2017 pilot study, 84.6% of participants had friends of many nationalities, and 80% said their friends included Scottish people. Unsurprisingly, participants who felt part of their communities were more likely to have diverse friendships.
Data Source: 2018, GREC. Link.