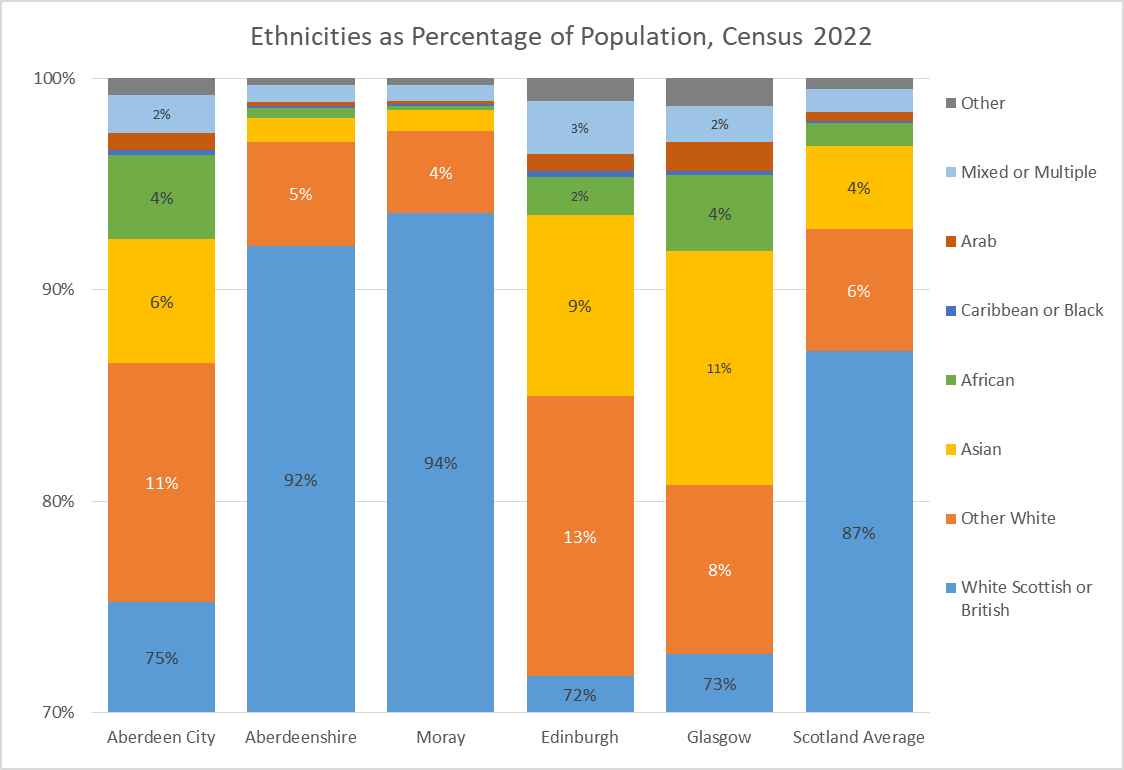
Note: Chart above has a lower value of 70%, to more clearly show ethnic minorities. Figures less than 1% omitted, but shown in the table below.
Ethnicities as Percentage of Population, Census 2022
| Aberdeen City | Aberdeen shire | Moray | Edinburgh | Glasgow | Scotland | |||||||
| White Scottish or British | 168524 | 75% | 243045 | 92% | 87459 | 94% | 368362 | 72% | 451645 | 73% | 4737313 | 87% |
| White, non Scottish/British | 25403 | 11% | 12972 | 5% | 3596 | 4% | 68382 | 13% | 49384 | 8% | 314574 | 6% |
| Mixed or multiple ethnic groups | 3990 | 1.8% | 2074 | 0.8% | 708 | 0.8% | 12882 | 3% | 10624 | 1.7% | 60899 | 1.1% |
| Asian | 13091 | 6% | 2939 | 1.1% | 913 | 1% | 44070 | 9% | 68793 | 11% | 212026 | 4% |
| African | 8870 | 4% | 1313 | 0.5% | 156 | 0.2% | 9462 | 1.8% | 22272 | 4% | 58636 | 1.1% |
| Caribbean or Black | 549 | 0.2% | 255 | 0.1% | 111 | 0.1% | 1419 | 0.3% | 1471 | 0.2% | 6780 | 0.1% |
| Arab, Arab Scottish or Arab British | 1783 | 0.8% | 436 | 0.2% | 116 | 0.1% | 4119 | 0.8% | 8671 | 1.4% | 22311 | 0.4% |
| Other ethnic group | 1817 | 0.8% | 682 | 0.3% | 236 | 0.3% | 5849 | 1.1% | 7903 | 1.3% | 27311 | 0.5% |
Data Source: 2022, Census table UV201. Link.