Please click on the place names below for relevant charts and tables.
Note: ‘Self-Employed’ includes both full-time and part-time. ‘Economically Inactive’ includes people who are retired, students, looking after home or family, long-term sick or disabled, and other forms of economic inactivity.
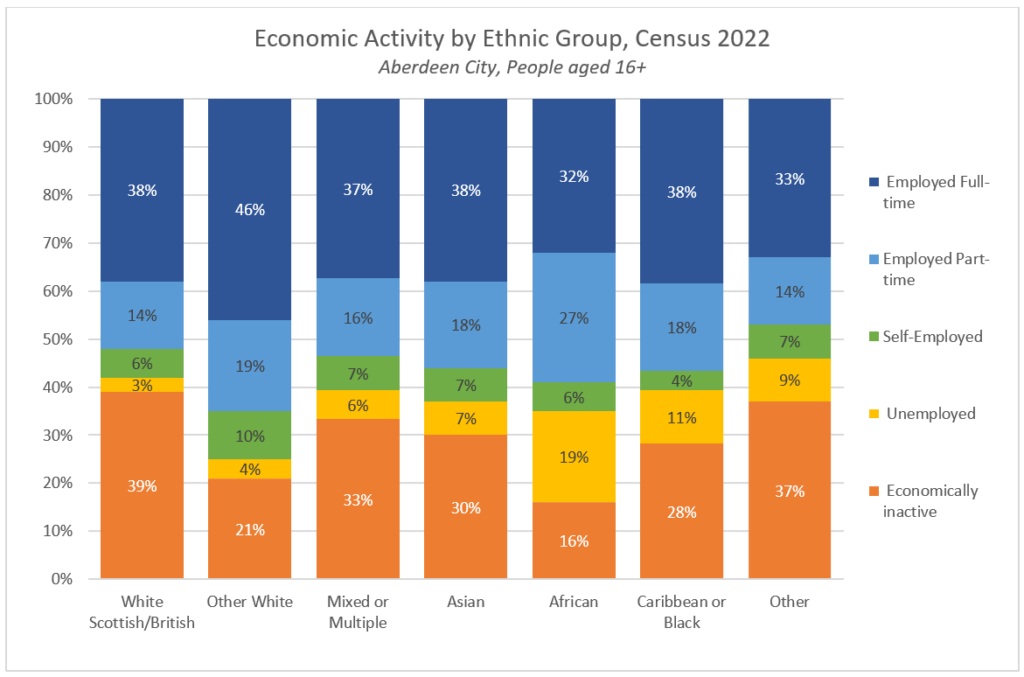
Economic Activity by Ethnic Group,
people aged 16+ in Aberdeen City, Census 2022
| Ethnic Group | Employed Full-Time | Employed Part-Time | Self-Employed | Unemployed | Economically Inactive | Total (aged 16+) |
|---|---|---|---|---|---|---|
| White Scot/Brit | 38% 55,899 | 14% 20,175 | 6% 8,036 | 3% 4,584 | 39% 57,184 | 145,878 (77%) |
| Other White | 46% 9,766 | 19% 4,033 | 10% 2,086 | 4% 918 | 21% 4,587 | 21,390 (11%) |
| Mixed or Multiple | 37% 875 | 16% 386 | 7% 169 | 6% 144 | 33% 780 | 2,354 (1%) |
| Asian | 38% 3,825 | 18% 1,756 | 7% 736 | 7% 688 | 30% 2,947 | 9,952 (5%) |
| African | 32% 1,952 | 27% 1,661 | 6% 338 | 19% 1,145 | 16% 1,001 | 6,097 (3%) |
| Caribbean or Black | 38% 170 | 18% 79 | 4% 20 | 11% 51 | 28% 125 | 445 (0.2%) |
| Other | 33% 895 | 14% 385 | 7% 190 | 9% 231 | 37% 1,007 | 2,708 (1%) |
| Total (aged 16+) | 39% 73,381 | 15% 28,479 | 15% 11,576 | 6% 7,756 | 4% 67,636 | 188,828 |
Note: ‘Self-Employed’ includes both full-time and part-time. ‘Economically Inactive’ includes people who are retired, students, looking after home or family, long-term sick or disabled, and other forms of economic inactivity.
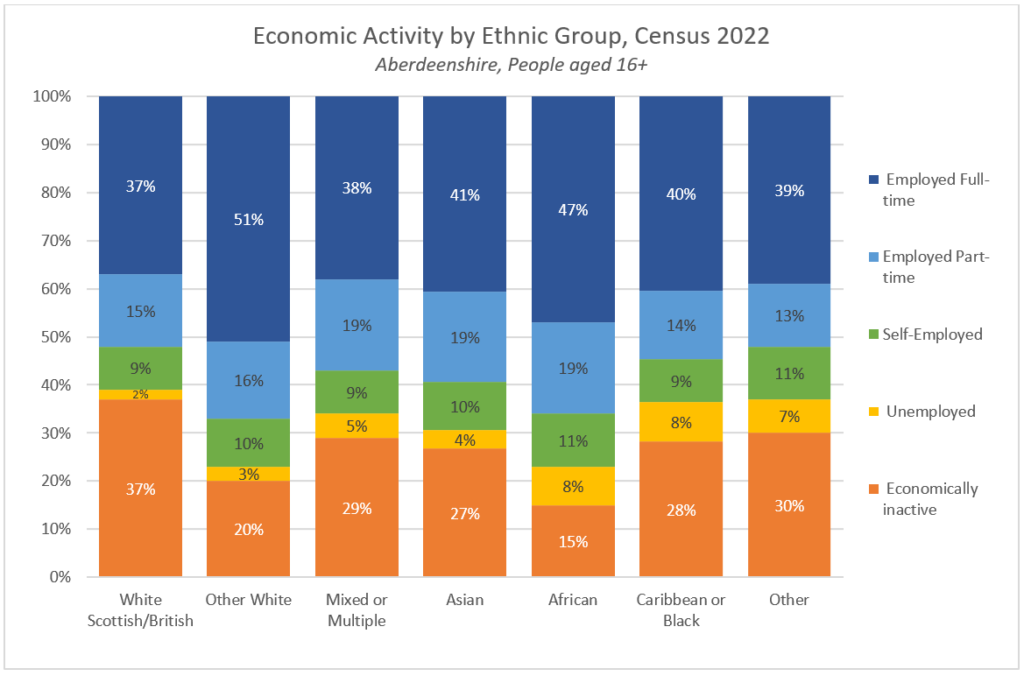
Economic Activity by Ethnic Group,
people aged 16+ in Aberdeenshire, Census 2022
| Ethnic Group | Employed Full-Time | Employed Part-Time | Self-Employed | Unemployed | Economically Inactive | Total (aged 16+) |
|---|---|---|---|---|---|---|
| White Scot/Brit | 37% 73,019 | 15% 30,153 | 9% 18,476 | 2% 3,719 | 37% 73,873 | 199,240 (93%) |
| Other White | 51% 5,421 | 16% 1,715 | 10% 1,074 | 3% 320 | 20% 2,165 | 10,695 (5%) |
| Mixed or Multiple | 38% 390 | 19% 198 | 9% 92 | 5% 53 | 29% 300 | 1,033 (0.5%) |
| Asian | 41% 886 | 19% 409 | 10% 216 | 4% 91 | 27% 582 | 2,184 (1%) |
| African | 47% 380 | 19% 149 | 11% 85 | 8% 64 | 15% 124 | 802 (0.4%) |
| Caribbean or Black | 40% 82 | 14% 29 | 9% 18 | 8% 17 | 28% 58 | 204 (0.1%) |
| Other | 39% 341 | 13% 112 | 11% 97 | 7% 62 | 30% 268 | 880 (0.4%) |
| Total (aged 16+) | 37% 80,524 | 15% 32,764 | 9% 20,053 | 2% 4,323 | 36% 77,360 | 215,024 |
Note: ‘Self-Employed’ includes both full-time and part-time. ‘Economically Inactive’ includes people who are retired, students, looking after home or family, long-term sick or disabled, and other forms of economic inactivity.
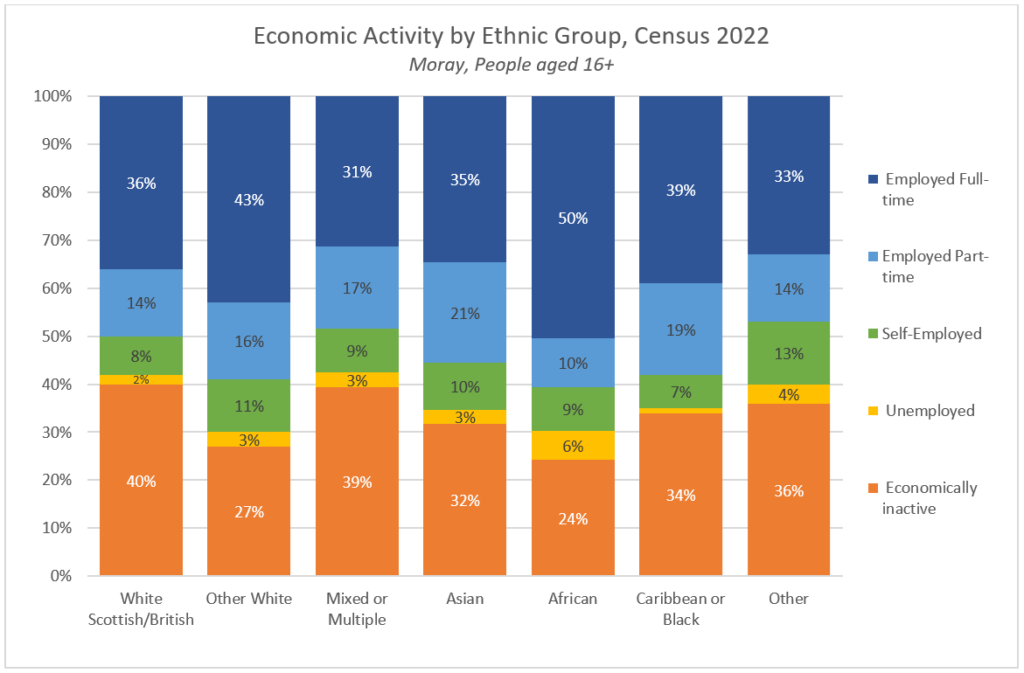
Economic Activity by Ethnic Group,
people aged 16+ in Moray, Census 2022
| Ethnic Group | Employed Full-Time | Employed Part-Time | Self-Employed | Unemployed | Economically Inactive | Total (aged 16+) |
|---|---|---|---|---|---|---|
| White Scot/Brit | 36% 26,095 | 14% 10,597 | 8% 5,852 | 2% 1,561 | 40% 28,983 | 73,088 (94%) |
| Other White | 43% 1,321 | 16% 474 | 11% 350 | 3% 86 | 27% 816 | 3,047 (4%) |
| Mixed or Multiple | 31% 128 | 17% 70 | 9% 37 | 3% 13 | 39% 160 | 408 (0.5%) |
| Asian | 35% 248 | 21% 148 | 10% 73 | 3% 19 | 32% 226 | 714 (1%) |
| African | 50% 58 | 10% 12 | 9% 11 | 6% 7 | 24% 28 | 116 (0.1%) |
| Caribbean or Black | 39% 38 | 19% 19 | 7% 7 | 1% 1 | 34% 33 | 98 (0.1%) |
| Other | 33% 90 | 14% 38 | 13% 36 | 4% 12 | 36% 99 | 275 (0.4%) |
| Total (aged 16+) | 36% 27,978 | 15% 11,360 | 8% 6,368 | 2% 1,699 | 39% 30,347 | 77,752 |
Note: ‘Self-Employed’ includes both full-time and part-time. ‘Economically Inactive’ includes people who are retired, students, looking after home or family, long-term sick or disabled, and other forms of economic inactivity.
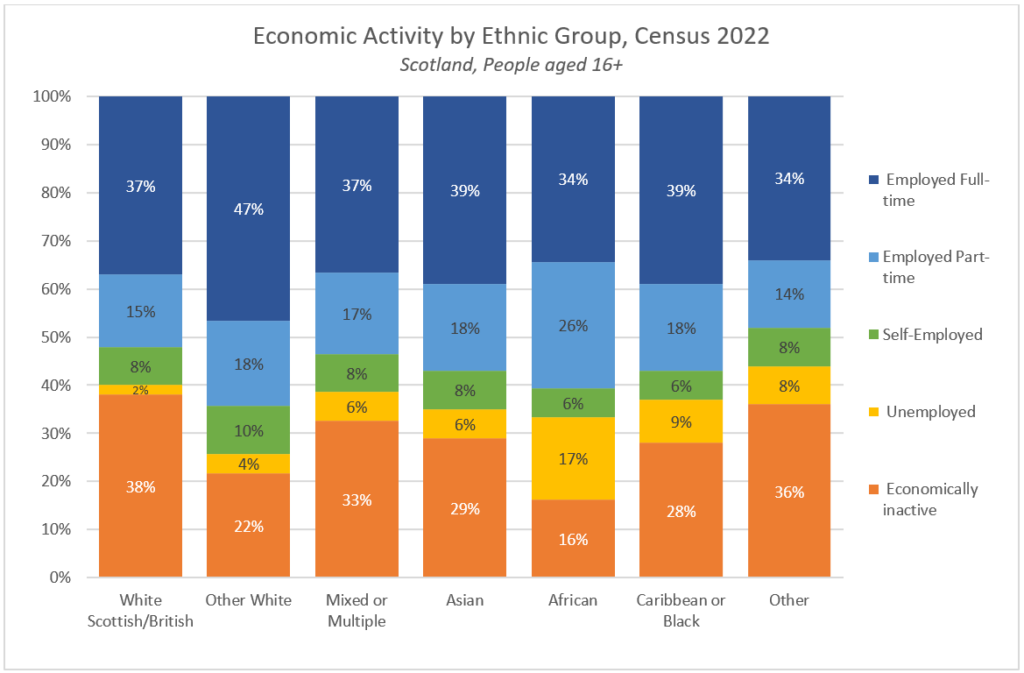
Economic Activity by Ethnic Group,
people aged 16+ in Scotland, Census 2022
| Ethnic Group | Employed Full-Time | Employed Part-Time | Self-Employed | Unemployed | Economically Inactive | Total (aged 16+) |
|---|---|---|---|---|---|---|
| White Scot/Brit | 37% 155,015 | 15% 60,926 | 8% 32,365 | 2% 9,866 | 38% 160,042 | 418,214 (87%) |
| Other White | 47% 16,508 | 18% 6,218 | 10% 3,510 | 4% 1,321 | 22% 7,558 | 35,115 (7%) |
| Mixed or Multiple | 37% 1,389 | 17% 654 | 8% 298 | 6% 210 | 33% 1,239 | 3,790 (0.8%) |
| Asian | 39% 4,955 | 18% 2,317 | 8% 1,028 | 6% 794 | 29% 3,755 | 12,849 3% |
| African | 34% 2,393 | 26% 1,825 | 6% 433 | 17% 1,213 | 16% 1,146 | 7,010 (1.5%) |
| Caribbean or Black | 39% 290 | 18% 131 | 6% 46 | 9% 66 | 28% 212 | 745 (0.2%) |
| Other | 34% 1,329 | 14% 535 | 8% 320 | 8% 305 | 36% 1,375 | 3,864 (0.8%) |
| Total (aged 16+) | 38% 181,881 | 15% 72,603 | 8% 37,995 | 3% 13,778 | 36% 175,343 | 481,600 |
Data Source: 2022, Census tables UV601 and UV210b. Link.