Please click each section heading for the full text of that section.
Homelessness, Tenancy & Overcrowding
Homelessness
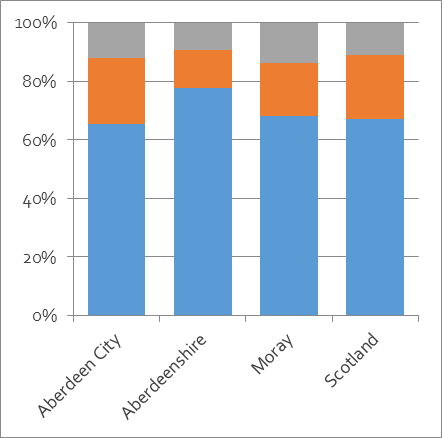
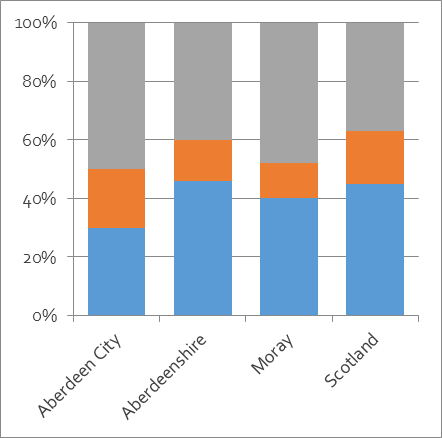
2018-19 is the most recent data available for homelessness applications by local authority and ethnicity, and even during this period, recording of ethnicity data seems patchy (see charts below).
Ethnicity of Homelessness Applicants by Local Authority, 2018-19
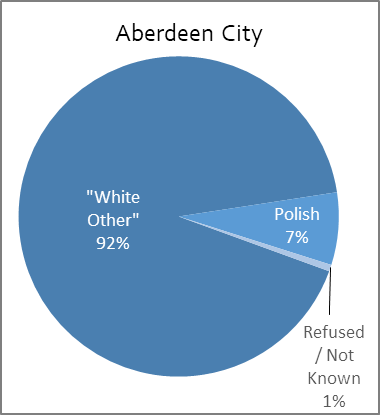
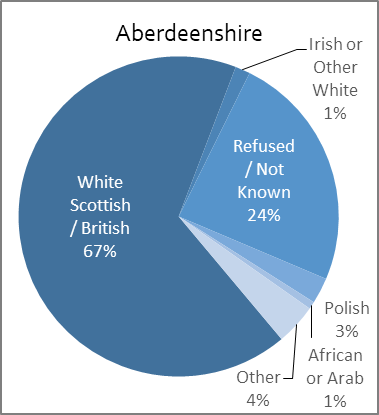
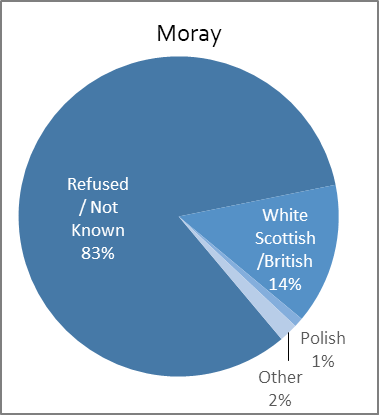
Data Source: 2019: Scottish Government, Homelessness Statistics: additional analysis by local authority, July 2019. Link.
Tenancy
Similar to the pattern across Scotland, ethnic minorities in Grampian lived with less secure tenure than Scottish/British people. On average, four times more ethnic minority people rent from private landlords than Scottish/British people, and even in Aberdeenshire, where home ownership is highest, less than half of ethnic minority people own their homes, compared with more than three-quarters of Scottish/British people.
This may be partly a function of the age and employment profile of the ethnic minority population, who are on average younger and working in more precarious jobs than their Scottish/British counterparts. Links between age, ethnicity, employment and housing will be fruitful topic to explore when the 2022 census data is released.
Tenancy by Ethnicity, 2011 Census
| Ethnicity | Abdn City | Abdn shire | Moray | Grampian | Scotland | |
| Owner-Occupied | Scottish/British | 66% | 77% | 69% | 70% | 67% |
| Owner-Occupied | Ethnic Minority | 30% | 46% | 40% | 39% | 45% |
| – | – | – | – | – | – | – |
| Social Rented | Scottish/British | 23% | 13% | 18% | 18% | 22% |
| Social Rented | Ethnic Minority | 20% | 14% | 12% | 15% | 18% |
| – | – | – | – | – | – | – |
| Private Rented | Scottish/British | 12% | 9% | 14% | 12% | 11% |
| Private Rented | Ethnic Minority | 50% | 40% | 48% | 46% | 37% |
Scottish/British
Ethnic Minority
Note: ‘Ethnic minority’ includes all non-‘white’ ethnic groups, plus White Irish, White Gypsy/Traveller, White Polish and White Other.
Data Source: 2011: Scotland’s Census 2011, Table DC4214SCca.
Overcrowding
Under-occupation and overcrowding are calculated using number of occupants and their relationships to determine the number of rooms a household requires. When the number of available rooms is smaller than what is required, the home is considered overcrowded.
Grampian’s level of overcrowding is lower than the Scottish average (9% vs 11%), but ethnic minorities disproportionately bear the brunt of this. Across Grampian, 25% of ethnic minorities live in overcrowded homes. This figure is similar to the national average for ethnic minorities (24%) and much higher than the figure for Grampian’s Scottish/British population (7%). In Aberdeen City, 33% of Africans lived in overcrowded conditions, similar to the Scottish average of 32%. In Moray, 25% of Asians lived in overcrowded homes, and in Aberdeenshire, the figure was 26% for people in the ‘white other’ ethnic group (including Europeans and Gypsy/Travellers).
Data Source: 2011: Scotland’s Census, Table LC4420SC.
Areas of Multiple Deprivation
Areas of Multiple Deprivation
Generally speaking, Grampian is an affluent part of Scotland. In the 2020 Scottish Index of Multiple Deprivation (SIMD), the Midstocket area of Aberdeen ranked the second least deprived in Scotland, and 116 areas in Grampian fell into the least deprived 10%. Meanwhile, eight areas in Grampian ranked among the 10% most deprived, and 20 in the 15% most deprived. This has shifted somewhat since 2016, with several more areas slipping down the league table of the most deprived in Scotland, and a reduction of those ranked most affluent.
Even with high levels of affluence overall, there is a significant demographic gap between the richest and poorest parts of Grampian. For example, combining SIMD and Census data, it is clear that a ethnic minorities are over-represented in deprived areas. On average, around a quarter (23%) of people in Grampian’s ten most deprived areas were ethnic minorities, up to nearly a third (32%) in Woodside (Aberdeen City). The figure was less than 15% in Grampian’s ten most affluent areas. However, ethnic minorities were over-represented in several affluent areas, especially around Aberdeen’s hospitals, emphasising the importance of ethnic minority workers in the health service.
The table below shows the ten most and least deprived areas in Grampian, with the proportions of different ethnicities among residents. While the figures are for 2012, most of these areas have remained in the same categories in 2016 and 2020. In more densely populated areas, one area may include several SIMD datazones, and often neighbouring datazones have similar SIMD scores. A lower score means a higher level of deprivation, based on measures of income, employment, health, education/skills, housing, crime, and geographic access to services.
Ethnicity by SIMD Datazones: Most Deprived Areas
| Datazone | SIMD Rank | Area Name | All People | Scottish/ British | % | Total Ethnic Minorities | % | · | ‘White’ Ethnic Minority | Mixed, Multiple or Other | Asian | African, Caribbean or Black |
| S01006634 | 500 | Torry East | 634 | 497 | 78% | 137 | 22% | · | 116 | 2 | 12 | 7 |
| S01007126 | 536 | Fraserburgh Harbour/Broadsea | 927 | 626 | 67% | 301 | 33% | · | 287 | 4 | 5 | 5 |
| S01006684 | 545 | Woodside | 684 | 477 | 70% | 207 | 30% | · | 135 | 15 | 30 | 27 |
| S01006636 | 675 | Torry East | 870 | 700 | 80% | 170 | 20% | · | 133 | 12 | 8 | 17 |
| S01006667 | 725 | Seaton | 741 | 537 | 72% | 204 | 28% | · | 132 | 9 | 35 | 28 |
| S01007086 | 754 | Peterhead Harbour | 1132 | 808 | 71% | 324 | 29% | · | 280 | 7 | 323 | 4 |
| S01006724 | 785 | Northfield | 1005 | 882 | 88% | 123 | 12% | · | 73 | 2 | 11 | 37 |
| S01006729 | 878 | Heathryfold/Middlefield | 831 | 704 | 85% | 127 | 15% | · | 70 | 5 | 30 | 22 |
| S01007088 | 884 | Peterhead Harbour | 539 | 452 | 84% | 87 | 16% | · | 83 | 2 | 2 | 0 |
| S01006727 | 893 | Heathryfold/Middlefield | 1015 | 754 | 74% | 261 | 26% | · | 232 | 4 | 10 | 15 |
| Total | 8378 | 6437 | 77% | 1941 | 23% | · | 1541 | 62 | 176 | 162 |
Ethnicity by SIMD Datazones: Least Deprived (Most Affluent) Areas
| Datazone | SIMD Rank | Area Name | All People | Scottish/ British | % | Total Ethnic Minorities | % | · | ‘White’ Ethnic Minority | Mixed, Multiple or Other | Asian | African, Caribbean or Black |
| S01006561 | 6975 | Midstocket | 766 | 664 | 87% | 102 | 13% | · | 40 | 21 | 30 | 11 |
| S01006689 | 6969 | Hilton | 629 | 497 | 79% | 132 | 21% | · | 49 | 14 | 47 | 22 |
| S01006935 | 6964 | Westhill Central | 699 | 659 | 94% | 40 | 6% | · | 17 | 4 | 19 | 0 |
| S01006559 | 6958 | Midstocket | 607 | 487 | 80% | 120 | 20% | · | 85 | 3 | 30 | 2 |
| S01006833 | 6957 | Stonehaven North | 455 | 423 | 93% | 32 | 7% | · | 23 | 3 | 4 | 2 |
| S01006575 | 6956 | West End South | 951 | 786 | 83% | 165 | 17% | · | 99 | 18 | 38 | 10 |
| S01006581 | 6955 | West End South | 889 | 787 | 89% | 102 | 11% | · | 74 | 6 | 17 | 5 |
| S01006573 | 6949 | West End North | 724 | 607 | 84% | 117 | 16% | · | 83 | 10 | 13 | 11 |
| S01006570 | 6946 | Rosemount | 791 | 608 | 77% | 183 | 23% | · | 73 | 12 | 68 | 30 |
| S01006933 | 6945 | Westhill North/South | 580 | 554 | 96% | 26 | 4% | · | 10 | 4 | 8 | 4 |
| Total | 7091 | 6072 | 86% | 1019 | 14% | · | 553 | 95 | 274 | 97 |
Demographic Data: Scotland’s Census 2011, Table LC2801SC.
Data Source: 2020: Scottish Index of Multiple Deprivation. Link.
Key Missing Data
Apart from some material in the Local Housing Needs Assessment for Aberdeen City, there appears to be no available data linking housing, ethnicity and reasons for homelessness across Grampian.
Qualitative Data from Relevant Local Research (2018-2021)
The Human Cost of Brexit (Housing)
In an online roundtable discussion, members of community groups and third & public sector organisations reflected on Brexit’s impact on EU citizens in North East Scotland. Six speakers presented diverse perspectives and more than 65 people attended the discussion that followed, raising the concerns of local communities.
Speakers and participants highlighted key issues regarding access to housing due to Brexit. EU nationals now face the same ‘hostile environment’ as non-EU migrants, with exhaustive procedures to live and work in the UK. When landlords and employers are required to take nine steps to check someone’s status online, it is likely to lead to a preference for applicants with a British passport or physical residence permit. Participants felt there was not enough information and guidance about the changes arising from Brexit, reinforcing that landlords and employers do not have enough knowledge of the new rules, which can lead to discrimination.
More broadly, people subjected to immigration controls have always been excluded from housing and homelessness provision, but prior to Brexit, this did not apply to EU citizens. Therefore, the Scottish Anti-Destitution strategy is undermined by Brexit and the impact of more people included in the No Recourse for Public Funds (NRPF) category. The absolute deadlines imposed by Brexit have made prevention of destitution much more complex.
Data Source: 2021: Shared Futures and No Recourse North East. Link.
Aberdeen Equality Outcomes Consultation (Housing)
During August and September 2020, GREC conducted a survey to gather feedback from people with protected characteristics to feed into Aberdeen City Council (ACC)’s Equality Outcomes. The survey was complemented by a series of focus groups held in October and November. In total, over 200 people took part.
While most participants did not feel their homes were overcrowded, nearly a third of ethnic minority participants felt their homes were sometimes too damp or too cold, and the same proportion found that housing related issues had resulted in a household member suffering a health problem. The figure for Scottish/British participants was 18% and 8%, respectively. Many also highlighted a lack of affordable housing in Aberdeen City.
New Scots (Syrian Refugees) in Aberdeenshire (Housing)
Aberdeenshire Council faced significant logistical challenges in organising suitable housing for the Syrian New Scots community. When families began to arrive in 2015, they were initially given private accommodation rented by the council for a two year period, in a Private Sector Leasing (PSL) scheme. The expectation was that they would transition into more typical Private Residential Tenancies (PRTs) afterwards. This scheme worked well until 2019, when issues began to arise, including the changing needs of tenants (mobility, children, etc), and landlords wishing to sell or move back into their properties. Some landlords also wanted to end their legal agreement with Aberdeenshire Council, in order to charge higher rent.
A temporary Housing Officer was appointed in 2019, to provide dedicated support to New Scots clients, and the post was made permanent in 2021. They have supported clients with housing and homelessness applications, communication with landlords, organising repairs, and other matters. They have also identified issues around overcrowding, affordability (even for those working), damp conditions, domestic abuse, and neighbours’ anti-social behaviour. Meanwhile, the housing market had shifted since 2015, with fewer available properties, higher rental costs, and significant impacts on families with three or more children due to the Benefit Cap. Broadly speaking, they found that the needs of New Scots were similar to those of social housing clients, requiring ongoing support. Anecdotal evidence also showed that the only New Scots tenants who could afford to move into employment were those in two-bed private housing, due to Local Housing Allowance rates.
During 2020, Covid-19 led to many PSL tenancies being extended for a year, but transitions into PRTs resumed in 2021. However, one year post-transition, only 10% of New Scots tenants remained in their original private sector home, and most landlords have expressed plans to sell their properties when their PSL agreement ends. Therefore, the housing strategy for future groups of New Scots will focus on social housing rather than private rented accommodation, to minimise disruption, allow for better support, and ensure more secure tenancies.
From HFINES 2018
At a consultation event in September 2017, several housing issues came up. For example, several participants commented that their housing was too small or unsuitable for other reasons, but they faced long wait times for new accommodation. Some were placed in housing far away from family members, and for others rural isolation was a problem. There were also some issues with noisy neighbours. Generally speaking, these were the same kinds of issues faced by other ethnic minorities, and by Scottish/British people in deprived areas.
Data Source: 2021: Aberdeenshire New Scots Housing Strategy Review Discussion Paper (Internal).
Qualitative Data from Relevant Local Research (pre-2018)
Minority Ethnic Housing Project
Up until 2017, when funding ceased, the Project provided advice and support to ethnic minorities facing homelessness and other housing issues.
Clients often presented with multiple issues, for example: financial problems that arise from errors with benefit payments may lead to the risk of eviction or even homelessness. The main issues faced by clients accessing the service between December 2015 and December 2016 included problems with benefits, eviction/homelessness, being threatened with eviction/homelessness, employability, overcrowding, affordable tenancy, rent arrears, immigration, problems with safety/health, domestic abuse, and money/debt problems.
Benefits and financial issues are the consistent problems facing clients. Since December 2015, affordability has been an issue in both privately rented accommodation and social housing, where tenants struggle with rental costs, even for temporary accommodation. As the welfare and immigration systems become more restrictive and complicated for migrants, more individuals are falling through the net and facing great financial hardship or homelessness. For many clients, financial problems have been directly linked to losing the right to reside (for EEA nationals), or dealing with No Recourse to Public Funds (NRPF). It is likely that further financial hardship and increased rent arrears can be expected with continual changes in welfare benefits, immigration legislation, and the Brexit process.
Impact of Benefit changes
From April 2014, EEA jobseekers without a permanent right to reside have been unable to claim Housing Benefit, and are now only allowed to receive Jobseekers’ Allowance for six months. Underoccupancy fees – the bedroom tax – was applied from March 2014, reducing Housing Benefit payments for tenants in social housing with one or more ‘spare’ bedrooms. As of April 2016, Housing Benefit can only be backdated by one month. Benefit caps, the shift to Universal Credit, and limits on Child Benefit will also reduce the amount many people can claim.
These issues, combined with outcomes of decisions made by the DWP, especially around the Right to Reside, can lead to individuals struggling financially, accruing debt and rent arrears, which they are then unable to repay with Housing Benefit.
Language barriers and a lack of knowledge about rights and entitlements have meant that a number of people accessing the MEHP service have done so at crisis point, when the timescale to resolve these issues is limited. All of the above has led to an ever-increasing requirement for the specialist advice provided by the MEHP.
Data Source: 2016: Minority Ethnic Housing Project (MEHP), 2016: Annual Report.
SSAMIS: Housing
Between 2013 and 2017, the Social Support and Migration in Scotland (SSAMIS) project interviewed over 200 migrants and 60 experts across Scotland, focusing their work on Aberdeen City and rural Aberdeenshire.
General Issues
Although some issues were migrant-specific, others reflect more general problems of local authority housing provision (e.g. long waiting lists) and the private rental sector (e.g. irresponsible landlords; long-term tenant insecurity). The negative impact of such issues were often magnified for migrants due to low levels of English and a lack of knowledge of the local context. Migrants were often unaware of their rights or where to go for help, and with smaller social networks, they had less informal support when facing difficult circumstances.
New arrivals often had difficulty understanding the rental market, and they often stayed with friends or family on arriving in Scotland, before looking for private rental or social housing. Many offered rooms temporarily to others once they were more established in Aberdeen/shire. They had mixed experiences with neighbours: not many instances of racism, but where relationships with neighbours broke down, this was often exacerbated by a lack of inter-cultural understanding on both sides, e.g. of norms around parking, loud music, parties, etc.
Private Rental Housing
There were mixed experiences here: some spoke positively despite living in cramped communal living arrangements, whereas others faced many problems with landlords.
Landlords were often reluctant to let to families with children, and they sometimes exploited
migrants’ lack of knowledge, for example walking into flats without prior permission, not returning security deposits, etc. Housing conditions were often substandard, with damp, mould or severe draughts, and security was an issue in some HMO properties, where rooms were rented out individually. Helping out family and friends was very common, but could lead to temporary overcrowding.
High demand was an issue across the region: in Aberdeen, migrants complained about being given social housing in areas of multiple deprivation; in Aberdeenshire, high demand for housing in towns meant a choice between social housing in small, rural villages, or staying in
privately rented accommodation for several years waiting for a town property to become available. Rural living could be seen as positive (e.g. quiet, secluded), but could also compound typical migrant problems such as social isolation. There was little ESOL support in rural areas and very limited opening hours for public spaces such as libraries. Public transport could be patchy, especially for those needing to work atypical hours/shift patterns in factories.
Both migrants and expert interviewees noted a common perception (though no evidence) that the housing queues were run unfairly – that particular nationalities or types of people would to ‘jump the queue’ or receive favourable treatment. This was usually due to a misunderstanding of pointsbased systems which prioritise certain demographics.
Buying Property
Many migrants considered buying a house a long-term goal, typically requiring being settled and established in a reliable job for several years. However, financial issues and high housing costs often kept this goal out of reach. In general, migrants who had bought property said it was fairly straightforward. Some with low levels of English received help from local, hourly-paid interpreters/advisors; others drew on local contacts made through their jobs. Experts working in Aberdeen City spoke about a growing number of Polish HMO landlords who rented properties to other migrants.
Employer-Provided Housing
In the early EU accession period (c.2004-2007), agencies would bring migrants to Scotland and promise that housing would be sorted out, but sometimes this was poor quality and overcrowded. This scenario has become less common in recent years, with housing being
run more responsibly by the companies involved. Agricultural workers were more likely to live in employer-provided accommodation; seasonal fruit-pickers in Aberdeenshire tended to live in on-site caravans of varying quality. Experts described situations where employers demanded significant deposits and charged for accommodation through wages, leaving workers very little actual pay.
More information, including briefing papers on a range of topics, is available on the SSAMIS website: Link.
Data Source: 2017: SSAMIS: Migrants and Housing in Aberdeen/shire. Link.
Summary & Priorities
The evidence above highlights some specific housing challenges faced by ethnic minorities in Grampian. Housing problems tend to be most prevalent in more deprived areas, but overall, ethnic minorities in Grampian live with less secure tenure than the Scottish/British population, with worse figures compared to the Scottish average. In addition, levels of over-crowding are noteworthy, despite not differing greatly from the national picture. Examining demographics alongside data on multiple deprivation, it is clear that ethnic minorities are over-represented in both poorer and richer areas, which aligns with findings in the Employment section above.
There are consistent gaps in data on homelessness and ethnicity at a local level, and more work is required to get a clearer understanding of which communities are being affected by homelessness and why. Issues linked to UK- and Scotland-wide policies, such as immigration rules, benefits system changes and the ‘hostile environment’ all affect access to housing as highlighted by recent qualitative data, which suggests that related issues are only becoming more significant as the consequences of Brexit and Covid-19 develop.
Priorities
- Gaining a better understanding of the communities most affected by homelessness and why.
- Ensuring appropriate support is in place for those falling through the gaps of immigration and benefit rules.
- Raising awareness among those living in over-crowded and poor-quality housing of where to seek information, advice and support.
- Focused work in areas of deprivation with high proportions of ethnic minorities.
Social Housing