Please click each section heading for the full text of that section.
Oil & Gas Context
Any discussion of employment in North East Scotland would be incomplete without considering the dominant role of the oil and gas industry. Oil price fluctuations have far-reaching consequences in all sectors, as seen in 2015-16 and 2020-21.
Skills Development Scotland recently carried out an analysis of school leaver destinations, giving a snapshot of how job losses in oil and gas (and knock-on effects in other industries) reduced opportunities for young people to enter employment on completing school. While 2019-20 saw young people entering employment at lower rates across Scotland, the reduction was greater in Aberdeen City and Aberdeenshire. The influence of the oil and gas downturn of 2015-16 was even more stark in Aberdeen City, which has yet to return to its pre-2015 levels.
School Leavers Entering Employment (%)
| 2014-15 | 2015-16 | Change 2014-16 | 2016-17 | 2017-18 | 2018-19 | 2019-20 | Change 2018-20 | |
| Aberdeen City | 21.6 | 14.5 | -7.1% | 15.4 | 18.5 | 17.7 | 8.7 | -9% |
| Aberdeenshire | 23.3 | 22.1 | -1.2% | 21 | 21 | 21.7 | 14.4 | -7.3% |
| Scotland | 21.4 | 22.3 | +0.9% | 22 | 22.7 | 22.9 | 16.2 | -6.7% |
Data Source: 2020: Skills Development Scotland.
Employment Rates
The most reliable source for employment rates by ethnicity is the Census. In 2011, employment in the Grampian region was higher than in Scotland as a whole, for both Scottish/British people and ethnic minorities. This follows the general pattern of the past decade (shown below).
The Office for National Statistics (ONS) estimates annual employment rates across the UK, using a sample of 100,000 people. While this is broadly representative, it is impossible to get a perfectly accurate picture, especially when considering small groups (such as ethnic minorities) in less densely populated areas (like Aberdeenshire and Moray). However, ONS data is the most accurate information available, and it gives a general picture between censuses.
Another shortcoming of ONS data is its ‘colour coding’ of ethnicity. Ethnic groups are listed as ‘white’ or ‘ethnic minority’, obscuring figures for ethnic minorities from Europe, Gypsy/Travellers, etc. Country of birth data resolves this problem to a certain extent, so below we examine figures for ‘white’ and ethnic minority people born in the UK, and those born outside the UK.
Employment Rates by Ethnicity: 2011
Including people who were employed or self-employed.
| Aberdeen City | Aberdeenshire | Moray | Grampian | Scotland | |
| Scottish/British | 78.8 % | 83.4 % | 80.4 % | 81.2 % | 75.3 % |
| Ethnic Minority* | 66.5 % | 79.1 % | 72.9% | 70.4 % | 62.3 % |
* Includes ‘colour coded’ ethnic minorities, Gypsy/Travellers, and ‘white’ categories except White Scottish/British.
Data Source: 2011: Scotland’s Census, Table DC6220Scca.
Employment Rates by Ethnicity & Nationality: 2019 & 2020 (estimate)
Including people who were employed, self-employed or furloughed.
| Abdn City 2019 | Abdn City 2020 | Abdn Shire 2019 | Abdn Shire 2020 | Moray 2019 | Moray 2020 | |
| ‘White’ UK Born | 79.8% | 70.7% | 79.9% | 80.1% | 75.0% | 76.2% |
| ‘White’ non-UK Born | 79.0% | 82.6% | 92.8% | 82.0% | 72.0% | 59.4% |
| Ethnic Minority UK Born | 81.7% | 60.9% | 88.5% | 77.8% | 76.2% | * |
| Ethnic Minority non-UK Born | 77.5% | 55.5% | 62.4% | 49.4% | 86.3% | 74.7% |
| Grampian 2019 | Grampian 2020 | Scotland 2019 | Scotland 2020 | |
| ‘White’ UK Born | 78.1% | 77.5% | 75.3% | 73.5% |
| ‘White’ non-UK Born | 82.6% | 80.7% | 80.2% | 78.7% |
| Ethnic Minority UK Born | 82.5% | 66.2% | 64.3% | 71.4% |
| Ethnic Minority non-UK Born | 76.7% | 54.8% | 57.9% | 61.9% |
* Data unavailable/unreliable due to small sample size. Figures are underlined where data was not available for country of birth, but was available for nationality – UK born and UK national are not exactly the same group (e.g. people can gain UK citizenship) but there is considerable overlap.
Data Source: 2020: ONS, Annual Population Survey, Calendar Years 2019 and 2020, Employment Rate, Age 16-64. NomisWeb.
Employment Rates by Ethnicity, 2011-2020
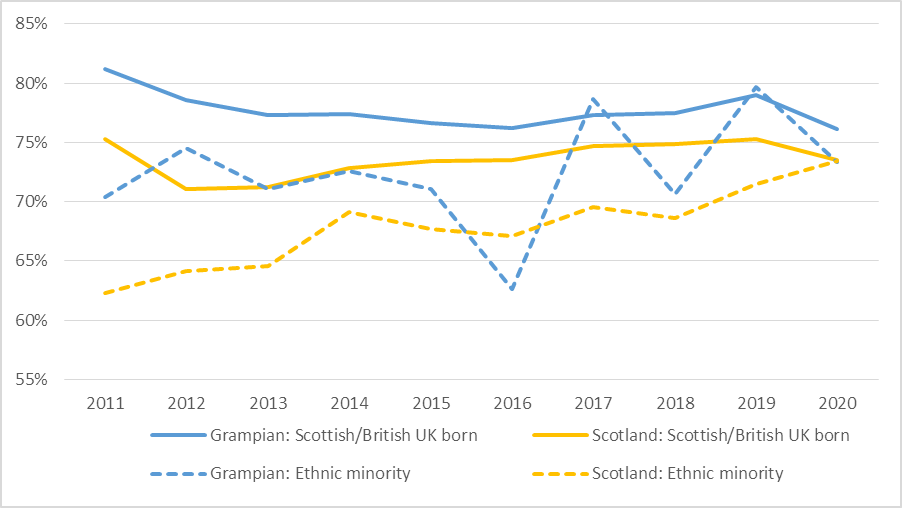
Note: the erratic shifts in Grampian’s ethnic minority employment rate are likely an effect of small sample size.
Data Source: 2021: ONS, Annual Population Survey, Employment Rate, Age 16-64. Data for 2011: Scotland’s Census 2011, Table DC6220Scca.
Employment – Key Patterns
Two key patterns emerge from the data:
- The employment rate for ethnic minority people – in Grampian and Scotland as a whole – tends to be lower than for Scottish/British people, despite ethnic minorities tending to have higher levels of education (see Education section below).
- Covid-19 led to widespread job losses in 2020; this affected different groups of people in different ways across Grampian and Scotland as a whole. Some of the hardest-hit groups was Grampian’s non-UK born ethnic minorities, whose employment rate dropped between 12 and 22 percentage points between 2019 and 2020. During the same period, the average employment rate across Scotland for this group actually increased slightly, though it was still the lowest in Scotland by 10 percentage points.
See also: Skills Development Scotland, Regional Skills Assessments, Aberdeen City and Shire, 2022 (link) and Skills Matrix (link). Aberdeenshire Employability Partnership (link), ABZ Works (link) and Moray Employability (link).
Other Points of Note (from 2011 Census)
- Unemployment: Aberdeen City unemployment rates for most groups were slightly lower than Scotland as a whole: on average 4.1% vs. 5.1%. The highest unemployment rate was among people born in Africa (10.7%), slightly higher than the Scottish average for African-born people (10.6%). Other regions of birth had unemployment rates between 3.4% (Oceania) and 6.1% (Europe, non-EU). The UK-born unemployment rate was 3.8%, and people born outside the UK generally had higher unemployment rates than those born in the UK. In Aberdeenshire and Moray, unemployment rates were considerably lower than the Scottish average, ranging between 2-5%, with UK-born unemployment rates of 2.6% in Aberdeenshire and 3.9% in Moray. As in Aberdeen City, unemployment was higher among people born outside the UK, with the exception of Oceania.
- Full & Part-Time Work: Across Grampian, a higher proportion of all people were in both full-time and part-time work than Scotland as a whole, on average 40.4% and 15.5%, vs. 36.4% and 14.3%. In all areas, the figure was slightly lower than average for people born in the UK, and slightly higher for people born in other European countries. In some cases the gap was considerable: for example, in Aberdeenshire, 60% of EU-born people were in full-time employment, vs. 39.9% of UK-born people. However, for a more complete picture, it is important to consider these figures alongside the types of jobs and industries people are working in (see below).
- Economic Activity & Inactivity: The category ‘Economically Active’ includes people who are working, looking for work, or on short-term sick leave or maternity leave. ‘Economically Inactive’ includes students, retirees, unpaid carers, people who have given up looking for work, and those who are unable to work due to long-term illness or disability.
- Grampian had higher levels of economic activity than the Scottish average: 66.9% vs. 62.8%. The most economically active group was people born in EU Accession (2001-2011) countries, e.g. Eastern Europe: 86.5% in Grampian and 84.2% in Scotland as a whole. The least economically active group was people born in Ireland: 60.2% in Grampian and 53.9% in Scotland as a whole. The figures for UK-born people were 66.2% and 62.5%, and with the exception of Ireland, all other groups had higher rates of economic activity. Across Grampian, more than 70% of adults born in Europe, Africa and Oceania were economically active, which makes sense given the age distribution of these groups (see section 6 on Health below).
Data Source: 2011, Scotland’s Census, Table DC6210SC.
Employment Classifications, Occupation Types & Industries
Employment Classifications
Note that these are based on ‘colour coded’ data, so do not take into account European minorities.
In Aberdeen City, 11.4% of people in higher managerial, administrative and professional jobs were ethnic minorities. This was the highest figure of any area in Scotland, and well above the Scottish average of 4.8%. The figures for Aberdeenshire and Moray were 2.2% and 1.5%, respectively. 17.5% of ethnic minority adults in Aberdeen City and 16.6% in Aberdeenshire were classed as higher managerial, administrative and professional workers.
The largest categories for ethnic minorities were full-time students in Aberdeen City (29.9%), Lower Managerial, Administrative and Professional in Aberdeenshire (17.8%), and Semi-Routine in Moray (18.7%). In Aberdeen City, 79.6% of ethnic minorities aged 16-24 were full-time students, compared with 56.3% of ‘white’ adults in the same age range. Figures for Scotland as a whole are slightly lower.
The proportion of ethnic minority adults who were long-term unemployed or had never worked was lower in Aberdeen City than the Scottish average: 5.4% vs. 11%, and in both cases, the majority of people in this category were women. The figures for ‘white’ adults were 2.9% and 4.8%, respectively. Among ‘white’ adults in Scotland as a whole, figures for men and women who had never worked or were long-term unemployed were similar: 4.9% and 4.6%.
In Grampian, 14.8% of ethnic minority women were looking after home or family, compared with 6.2% of ‘white’ women, 0.6% of ethnic minority men and 0.4% of ‘white’ men. The figures for Scotland as a whole were 14.3%, 5.3%, 1.2% and 0.7%, respectively. Asian women consistently had higher rates of looking after home and family, for example 19.8% of Asian women in Aberdeenshire were in this category.
Data Source: 2011: Scotland’s Census, Tables DC6206, DC6201SC.
Occupation Types
Note that these are based on ‘colour coded’ data, so do not take into account European minorities.
In some occupations, ethnic minority workers made up a higher proportion than their representation in the population as a whole, most notably in professional occupations in Aberdeen City (12% vs. 7.2%), but also in Aberdeenshire (2.2% vs. 1.4%), Moray (1.6% vs. 0.9%) and Scotland as a whole (4.9% vs. 3.3%). They were also over-represented across Grampian in caring, leisure and service occupations, sales and customer service occupations, and elementary occupations, including ‘low skilled’ jobs in cleaning, delivery, manufacturing, agriculture, construction, etc.
Across Grampian, ethnic minorities were under-represented among the following occupations: managers, directors and senior officials; associate professional and technical; administrative and secretarial; skilled trades. Consistently, the lowest proportion of ethnic minorities was among process, plant and machine operatives: 3.2% in Aberdeen City, 0.8% in Aberdeenshire, and 1.5% in Moray. This category includes many industrial jobs in oil and gas.
Meanwhile, the largest proportion of ethnic minority workers were in professional occupations: 33.1% in Aberdeen City, 26.2% in Aberdeenshire, 19.4% in Moray, and 25.1% in Scotland as a whole. The figure for ‘white’ workers was 19%, 16.1%, 11.3% and 16.5%, respectively.
Data Source: 2011: Scotland’s Census, Table DC6213SC.
Industries
In Aberdeen City, ethnic minorities made up 11% of the workforce in both human health and social work and accommodation and food service. 20% of the city’s ethnic minority workers were in the former; 12% in the latter. Unusually compared with Scottish averages, 9% of workers in professional, scientific and technical activities in Aberdeen were ethnic minorities: 13% of the total ethnic minority workforce. The figures were 3.6% and 5.7% in Scotland as a whole. 13% also worked in wholesale and retail trade / repair of motor vehicles and motorcycles.
20% of ethnic minority workers in Aberdeenshire and Moray also worked in human health and social work, and 24% of ethnic minority workers in Moray were based in accommodation and food service (15% in Aberdeenshire, and 16.7% in Scotland as a whole). As with Aberdeen City, another key industry was wholesale and retail trade / repair of motor vehicles and motorcycles, with 15% of the ethnic minority workforce in Aberdeenshire and Moray. Due to small population sizes, ethnic minorities made up small proportions of the overall workforce in all other industries.
Data Source: 2011: Scotland’s Census, Table DC6216SC.
Modern Apprenticeships, Small Businesses and Entrepreneurial Activity
Proportion of Modern Apprenticeships held by Ethnic Minorities vs. Proportion in Population, Financial Year 2020-21
| Aberdeen City | Aberdeenshire | Moray | Scotland | |
| % of MAs | 7.7 % | 1.5 % | 1.8 % | 1.6 % |
| % in Population (16+) | 8.4 % | 3.1 % | 1.3 % | 4.0 % |
See also: Skills Development Scotland, 2017. Participation Summaries: Aberdeen City (link); Aberdeenshire (link); Moray (link).
Data Source: 2021: ONS, Annual Population Survey, % ethnic minority, aged 16+, April 2020 to March 2021.
Small Businesses & Entrepreneurial Activity
While ethnicity data is not available for the North East, Scotland-wide research has found that people from ‘non-white’ ethnic backgrounds start businesses at a much higher rate than those from ‘white’ backgrounds. In 2019, the figures were 17% and 7%, respectively. However, in 2020, the former figure dropped to 13%, while the latter remained steady at 7%, indicating “greater precarity” in circumstances for ethnic minority communities.
Ultimately, a higher proportion of a small population is still a small number in absolute terms. Between 2015 and 2019, only 1-3% of Scotland’s small businesses were majority led by people from ‘non-white’ backgrounds, despite comprising 4.3% of the population.
Meanwhile, setting aside ethnicity, the proportion of people engaged in ‘early entrepreneurial activity’ across Scotland remained steady between 2019 and 2020. However, the North East saw a decline from 8.7% to 6.5%. Reasons for the difference in the North East included a perception of fewer good opportunities for start-ups, less confidence in success, and greater fear of failure, all of which have been diverging from the Scottish average for a few years. Researchers connected these individual attitudes to wider structural issues, like an economy made fragile due to its reliance on the oil and gas industry.
Research from 2016 identified similar concerns, along with other factors working against ethnic minority entrepreneurs in Aberdeen. These included limited access to finance, labour and support.
Global Entrepreneurship Monitor, 2013 (Link) and 2020 (Link).
2016: Rahman, Z, et al. ‘What influences ethnic entrepreneurs’ decision to start-up: Some evidence from Aberdeen, Scotland.’ Journal of Small Business and Enterprise Development. Link.
Data Source: 2019: UK Department for Business, Energy and Industrial Strategy. Link.
Key Missing Data
Data on earnings, under-employment and job satisfaction are not available by region and ethnicity – where available, there is Scotland-wide data for specific ethnic groups, or regional data that is not broken down by ethnicity. The same is true for data on the leadership of small businesses.
Qualitative Data from Relevant Local Research (2018-2021)
Community Planning Aberdeen, Population Needs Assessment (Employment)
This report highlights how the Covid-19 pandemic has pushed many people into poverty due to reduced income resulting from reduced hours, reduced levels of pay from the furlough scheme and loss of employment. Ethnic minority communities, together with women and young people, are likely to be particularly affected by these circumstances as they tend to work in less secure occupations with lower wages, pushing more people into poverty. According to the Equality and Human Rights Commission, ethnic minority people reported that they were less likely to have been furloughed during the pandemic, and more likely to have lost their jobs.
Data Source: 2021: Community Planning Aberdeen report. Link.
The Human Cost of Brexit (Employment)
In an online roundtable discussion, members of community groups and third & public sector organisations reflected on Brexit’s impact on EU citizens in North East Scotland. Six speakers presented diverse perspectives and more than 65 people attended the discussion that followed, raising the concerns of local communities.
Speakers highlighted the ‘hostile environment’ that EU nationals now face, with discrimination around employers, landlords and banks not knowing the rules – or taking advantage of the uncertain situation – and people experience issues accessing benefits, jobs and places to live. For example, employers and landlords are required to take nine steps to check someone’s status online. This is likely to lead to a preference for applicants with a British passport or physical residence permit.
Participants touched on similar issues, mentioning there was not enough information and guidance about the changes arising from Brexit, reinforcing that employers and landlords do not have enough knowledge of the new rules, which is likely to lead to discrimination.
Data Source: 2021: Shared Futures and No Recourse North East. Link.
Aberdeen Equality Outcomes Consultation (Employment)
During August and September 2020, GREC conducted a survey to gather feedback from people with protected characteristics to feed into Aberdeen City Council (ACC)’s Equality Outcomes. The survey was complemented by a series of focus groups held in October and November, which also supported the development of Aberdeen’s Health & Social Care Partnership (ACHSCP) Equality Outcomes. In total, over 200 people took part.
Among working-age survey participants (143), the employment rate was 68% for ethnic minorities –slightly lower than the average of 71% for all participants. One of the main findings was that more than half of participants from ethnic minority communities felt that their access to employment was restricted by at least one protected characteristic – and a significant number had two or more overlapping protected characteristics.
Feedback from the focus groups indicated that ethnic minority communities, especially African communities, felt there was ongoing discrimination relating to employment. There were different opinions on whether the origin of this discrimination was personal, institutional or systemic – but all participants agreed that it had a negative impact on people’s lives.
EU nationals felt they were disproportionately affected by the Covid-19 pandemic, given that most had come to Aberdeen for work, and many struggled in terms of employment and finances. Participants also mentioned that those without good English proficiency were experiencing further problems to access support during the pandemic, as all advice was provided through the phone.
Aberdeenshire Council Research (Employment)
While data was not collected on participant ethnicity in the Community Survey or Citizens’ Panel Survey, there were respondents in both who felt that ethnicity could present barriers to employment (48% and 30%).
Data Source: 2021: Aberdeenshire Council Equality Outcomes, Interim Engagement Analysis. Link.
New Scots (Syrian Refugees) in Aberdeenshire (Employment)
In 2018, there were 86 working-age adults in the Syrian New Scots’ community in Aberdeenshire. Most were engaged in volunteer work but only three were in employment. Covid-19 halted almost all volunteering opportunities, but employment levels have significantly increased. By 2021, two-thirds of working-age New Scots’ were in part-time or full-time employment, thanks in part to a dedicated Employability Keyworker for the group, who has assisted clients to overcome previous issues including rural isolation, language barriers and digital exclusion.
Summary from HFINES 2018
As of March 2018, 131 Syrian New Scots have settled in Aberdeenshire as part of the Syrian Vulnerable Persons Relocation Scheme and the Vulnerable Children’s Relocation Scheme. Of the 86 adults of working age, three were employed, 29 were seeking work, 15 were studying, 27 were unpaid carers, and 10 were long-term sick or disabled. Additionally, nearly all eligible adults were volunteering, either within or outwith the refugee community, and attending a job club.
A range of support structures have been put in place through both the Council and the wider
community, including language classes, support workers, drop-in advice sessions, welcome packs, etc, but while participants have appreciated these, they are often regarded as inadequate to meet all needs. In a consultation event with 122 participants discussing refugee integration (6 September 2017), employability was a key issue, with language as a top barrier to employment. Other examples that came up frequently included better access to work/training, more volunteering opportunities (including opportunities to use existing skills), and support for self-employment. Participants expressed frustration with a sense of dependency, and a desire to work as a way of gaining independence, using their skills, integrating in the local area and contributing to their communities.
These kinds of frustrations will be familiar to anyone with experience of unemployment, and many of the solutions suggested in the consultation would be beneficial to a range of different groups (for example, access to childcare, local support in rural areas, web-based resources, peer learning, better transport links, better training for JobCentre staff, etc).
Data Source: 2021: Syrian New Scots Partnership.
Qualitative Data from Relevant Local Research (pre-2018)
SSAMIS: Employment
Between 2013 and 2017, the Social Support and Migration in Scotland (SSAMIS) project interviewed over 200 migrants and 60 experts across Scotland, focusing their work on Aberdeen City and rural Aberdeenshire.
Note on method and sample for Employment section: Most research participants worked in the fish industry, agriculture, or low-skilled sectors like care or hospitality. Very few were unemployed. A small number were selfemployed or owned businesses, usually having lived in Scotland for at least five years.
Motivations
Finding stable employment was a key motivating factor for Central and Eastern
European (CEE) migrants coming to Scotland. Other factors motivated long-term settlement, including family, lifestyle, long-term security and welfare support. Migrants found work through agencies (in country of origin or after arrival); through existing social networks in North East Scotland; and less often through local resources (websites, JobCentre, etc).
The insecurity of low-skilled, low-paid work
Many participants discussed their vulnerability in a pool of unskilled labour, especially new arrivals, those with lower levels of English, and those with long-term agency work or zero-hours contracts. Difficulties included: not receiving full pay; not understanding employment contracts; not knowing about rights such as paid leave; discrimination
around language use; inter-nationality group tensions; only being told their hours at short notice; being unable to make plans due to a lack of reliable income; being forced to move around Scotland or the UK for seasonal work. Migrants could also be reluctant to take up certain rights for fear of losing their jobs.
Work hazards
The Aberdeenshire fishing industry could be dangerous; several migrants had lost
family or friends working on boats or in factories. Fish factory work could cause chronic health issues such as skin conditions or repetitive strain injuries.
Occupational mobility
Many migrants were overqualified for their low-skilled roles, and while they had generally arrived in Scotland with plans to accept low-skilled work, many became ‘stuck’ due to low English language skills and a lack of opportunities or time to improve them, or to improve other qualifications. There was also a lack of varied jobs and industries in rural Aberdeenshire. Whatever the reason, de-skilling had negative emotional effects, especially for those staying long-term who were unable to find work more suited to their education, skills and previous experience. One way migrants responded to this was to become self-employed in sectors such as construction, mechanics, interpreting, cake decorating, or beauty and hairdressing. Others gained experience via volunteering, which led to better local knowledge and social networks, which in turn improved
occupational mobility. However, some sectors (such as the oil industry) could be difficult to access due to migrants’ lack of local networks and industry contacts.
Building connections
Positive relationships with employers and co-workers (generally other migrants) were key to job satisfaction and vital to finding housing, understanding bureaucratic
processes, building local networks and developing a safety net. It was relatively rare for migrants to form bonds with Scottish co-workers, and many spoke Polish or Russian at work, which hindered chances to improve English skills. However, some migrants worked long-term in smaller businesses or farms, where they interacted with Scottish locals.
More information, including briefing papers on a range of topics, is available on the SSAMIS website: Link.
Data Source: 2017: Summary write-up based on SSAMIS project fieldwork. Link.
Tackling Economic Barriers Pilot Study
A pilot study was carried out by GREC from March to June 2017, using short questionnaires about experience of working life in the UK. Even with a small sample size of 65, some interesting patterns emerge.
Most participants were happy with their present or most recent jobs, including all full-time workers and 90% of long-term residents. The largest dissatisfied group was part-time workers, a quarter of whom were not happy with their jobs.
Similarly, most participants knew where to look for a new job, with the notable exception of those with lower skill in spoken English, around half of whom did not know where to look. This group also tended to work in lower status occupations.
Despite job satisfaction, 43% of participants felt their jobs were not a good match for their skills and qualifications, though this figure declined with length of residence in the UK. Two-thirds of participants resident for less than 5 years felt they lacked opportunities for career progression, and half felt insecure in their jobs. For those resident more than 5 years, each of these figures decreased by half. Participants in higher-status jobs (managers, engineers, etc) tended to be more positive about their opportunities.
Getting a job seems to become easier with length of residence: three-quarters of new arrivals considered it difficult to get a job, compared with less than a quarter of those resident 5+ years. However, this may be a self-selecting pattern – those without employment face visa restrictions.
The chance of experiencing discrimination at work also appears to rise over time, reported by 17% of participants who had lived in the UK less than 5 years, and 37% of those resident 5+ years. Men and participants with poorer English skills were more likely to experience discrimination – 42% and 40% respectively, versus 23% of women and 18% of participants with better English skills.
Data Source: 2017: Unpublished Research by GREC.
Economic Experiences of Different Ethnic Groups in North East Scotland
GREC conducted research in 2015-17, with over 200 people taking part in surveys, interviews and focus groups. 71% of research participants faced barriers, difficulties or obstacles in looking for work. Among those who had not, some had not looked for work because of family commitments.
Almost a third of participants had underestimated how long it can take to secure a job, and 20% of participants – all female – had trouble finding work due to lack of childcare. Those who cited discrimination (16%) tended to be more highly qualified, with higher expectations about how they should be treated by employers. 10% of participants felt they were disadvantaged by their lack of experience in Scotland, and their qualifications not being recognised. This was associated with a general lowering of expectations and either acceptance or frustration at being underemployed.
Only 14% of participants mentioned language, including issues with jargon and dialects – but most participants did not seek jobs which required English proficiency. However, this also contributes to people becoming ‘stuck’ in particular types of employment.
Also see 2016 Interim Summary Report: Link.
Data Source: 2017: Economic Experiences of Different Ethnic Groups in North East Scotland: Final Summary Report. Link.
Challenges for Ethnic Minority Small Business Owners
Researchers conducted interviews with 25 ethnic minority business owners in Aberdeen, all of whom faced difficulties in accessing labour, due to frequent changes to immigration rules. Challenges in attracting ethnic majority staff lead to a heavy reliance on student workers, but pathways for students to remain in the UK are narrowing. Meanwhile, Aberdeen’s economy is tied to oil price fluctuations, creating rapid changes in access to finance, demand for goods and services, prices for energy and raw materials, etc. The authors argue that ethnic minority entrepreneurs have less robust support systems to deal with these issues, leaving them much more vulnerable to failure.
Data Source: 2016: Rahman, Z, et al. ‘What influences ethnic entrepreneurs’ decision to start-up: Some evidence from Aberdeen, Scotland.’ Journal of Small Business and Enterprise Development. Link.
Summary & Priorities
The quantitative data and local research present a mixed picture of economic experience among ethnic minorities in Grampian in the last decade. Some have had success working in the oil and gas industry, healthcare and higher education, while many have become ‘stuck’ in lower status and more precarious jobs in fish processing, agriculture and hospitality. On a number of employment indicators, mainly from the 2011 Census, ethnic minorities fare better than the majority population, and several data points suggest that ethnic minorities in Grampian have better employment outcomes than those in Scotland as a whole.
However, the broad patterns in Grampian tend to align with national trends, and the employment rate for ethnic minority people remains lower than for Scottish/British people, despite higher levels of education. In one particularly stark example, Africans in Grampian have the highest proportion of degree-level qualifications, but also face the highest unemployment rate (more than 10%). While no ethnicity data is available for the North East region, it is clear that ‘non-white’ ethnic minorities across Scotland start businesses at higher rates than the rest of the population, but face significant challenges and remain under-represented in business leadership.
In addition to existing patterns of employment inequality, ethnic minorities have suffered worse job losses during Covid-19. Grampian’s non-UK-born ethnic minorities have been hardest hit, potentially due to insecure employment and barriers to accessing information and support. Qualitative data shows that ethnicity continues to be perceived as a barrier for employment. Many of the challenges that ethnic minorities face in this area – such as language barriers, absence of opportunities to match skills and development, and lack of childcare – have been exacerbated by Covid-19 and Brexit.
Special attention should be given to how all these factors impact on women looking after home or family, as in 2011 the rates were higher – both for ethnic minorities and Scottish/British women – than the national average.
Priorities
- Ensuring that ethnic minorities have opportunities to improve their English language skills where required; to develop other employability skills; to transfer qualifications from their countries of origin; and to gain awareness of workplace rights.
- Ensuring increased engagement with (and opportunities for) Africans and other communities with the highest rates of unemployment in Grampian.
- Developing a better understanding of the unequal impacts of Covid-19 and Brexit on the employment of ethnic minorities and others with protected characteristics, including the intersectional ways that issues manifest.