Please click each section heading for the full text of that section.
Population
While the decade between 2009-2019 was a period of overall population increase in North East Scotland, recent years have seen a reversal of this trend, most likely due to the loss of jobs in the oil and gas sector, and the effects of both Brexit and Covid-19 on inward migration.
Between mid-2018 and mid-2019, both Aberdeen City and Moray experienced an increase (by 0.5% and 0.3%, respectively) while Aberdeenshire experienced a net decrease in population (by 0.1%).[1] An increase in migration away from the North East to the rest of Scotland and the rest of the UK peaked in 2015-16, and overseas migration into the North East has been declining during the same period.[2]
However, nearly a third of Aberdeen City’s inward migration still comes from overseas, a figure comparable to Glasgow and Edinburgh.[3] Across the UK, people from ethnic minorities are more likely to live in cities and large towns than in rural areas[4] and this pattern is replicated across Grampian.
[1] National Records for Scotland (NRS), Mid-Year Population Estimates, Scotland, mid-2019. Link.
[2] 2019 Population Estimates Briefing Note, Aberdeen City Council. Link.
[3] National Records for Scotland, Mid-Year Population Estimates, Mid-2018-19, published April 2020. Link.
[4] SPICe Briefing: Ethnicity and Employment, Suzi Macpherson, 09 June 2015.
Ethnicity
Ethnicity: Census Data
The Census is the most reliable source for ethnicity data, which is not collected in Scotland’s Mid-Year Population Estimates (though it does present data on country of origin).
In 2011, the most diverse wards in Aberdeen City were Tillydrone/ Seaton/ Old Aberdeen and Torry/ Ferryhill, where 33% and 23% of the population were ethnic minorities. Overall, Aberdeen City was more ethnically diverse than Scotland as a whole, with 2-3 times more people with Polish, ‘other white,’ Asian, and mixed backgrounds; and nearly 4 times more Africans than Scotland as a whole.
The most diverse wards in Aberdeenshire and Moray were Fraserburgh and District (10.5% ethnic minorities), Peterhead North and Rattray (9.9%), and Elgin City South (6.7%) and North (6.3%). Most of the ethnic minorities in these wards were of Eastern European origin.
Grampian Population Ethnicity Data, 2011
| Ethnic Group | Number | % |
| All people | 569,061 | 100% |
| White: Scottish | 448,133 | 79% |
| White: Other British | 64,891 | 11% |
| White: Irish | 3,805 | 1% |
| White: Gypsy/Traveller | 533 | 0.1% |
| White: Polish | 11,036 | 2% |
| White: Other White | 17,692 | 3% |
| Mixed or multiple ethnic groups | 2,491 | 0.4% |
| Asian, Asian Scottish/British | 12,155 | 2% |
| African, African Scottish/British | 5,620 | 1% |
| Caribbean, Black, or Caribbean/Black Scottish/British | 914 | 0.2% |
| Other ethnic groups | 1,791 | 0.3% |
Data Source: 2011: Scotland’s Census, Table KS201SC.
Ethnicity: NHS Data
Grampian Population Ethnicity Data, 2021 – age 40+ only
More recent data is available from NHS Scotland, where (colour coded) ethnicity is recorded with a person’s CHI Number, by health board. In statistics on Covid-19 vaccine uptake, the population for each ethnicity was listed, but only for age 40+. It may be possible to get broader data, though as shown in the table below, a significant number of people are ‘ethnic group unknown.’
| Ethnic Group | Number |
| Total: All people (AGE 40+) | 318,693 |
| White: Scottish | 145,428 |
| White: Other British | 49,925 |
| White: Irish | 866 |
| White: Gypsy/Traveller | 361 |
| White: Polish | 2,224 |
| White: Other White | 6,630 |
| White: Subgroup Unknown | 13,671 |
| Asian, Asian Scottish/British | 3,299 |
| African, African Scottish/British | 1,267 |
| Caribbean, Black, or Caribbean/Black Scottish/British | 320 |
| Mixed or multiple ethnic groups | 575 |
| Arab, Arab Scottish/British | 184 |
| Other ethnic groups | 1,496 |
| Unknown | 92,447 |
Data Source: 2021: Vaccination Uptake: Individuals in receipt of dose 1 of COVID-19 vaccine up to and including 25 May 2021.
Ethnicity: Pupil Census Data
The annual pupil census records data for Scottish schools, providing more precise figures than the ONS population estimates, if only for children and young people. As shown below, schools in Aberdeenshire and Moray have smaller proportions of ethnic minority pupils than the Scottish average, while Aberdeen City has a much higher proportion. This makes sense, given that Aberdeen City has a large immigrant and ethnic minority population, and that 1/3 of babies born in Aberdeen City have foreign-born mothers.
Pupil Ethnicity, 2021
| Total Pupils | Scottish/ British | % | Total Ethnic Minorities | % | · | ‘White’ Ethnic Minorities | % | Other Ethnic Minorities | % | Not known/ disclosed | % | |
| Aberdeen City | 24260 | 16017 | 66% | 7902 | 33% | · | 3496 | 14% | 4406 | 18% | 341 | 1% |
| Aberdeenshire | 36647 | 32398 | 88% | 3973 | 11% | · | 2419 | 7% | 1554 | 4% | 276 | 1% |
| Moray | 12217 | 11063 | 91% | 1053 | 9% | · | 627 | 5% | 426 | 3% | 101 | 1% |
| Scotland | 704723 | 581846 | 83% | 108001 | 15% | · | 42975 | 6% | 65026 | 9% | 14876 | 2% |
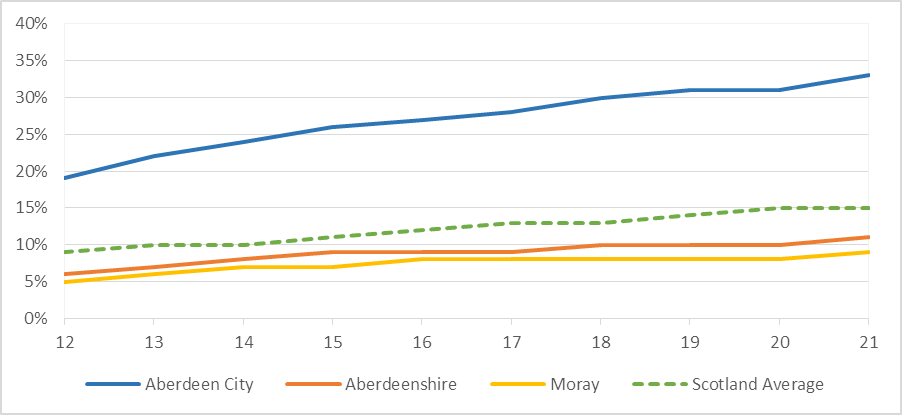
The proportion of ethnic minority pupils has been rising in the past decade, from 19% to 33% in Aberdeen City, 6% to 11% in Aberdeenshire, 5% to 9% in Moray, and 9% to 15% across Scotland as a whole.
Ethnic Minority Proportion of Pupils, 2012-2021
Data Source: 2021: Scottish Government Pupil Census, supplementary statistics (table 5.7). Link.
Ethnic Minority Percent of Population, 2004-2020
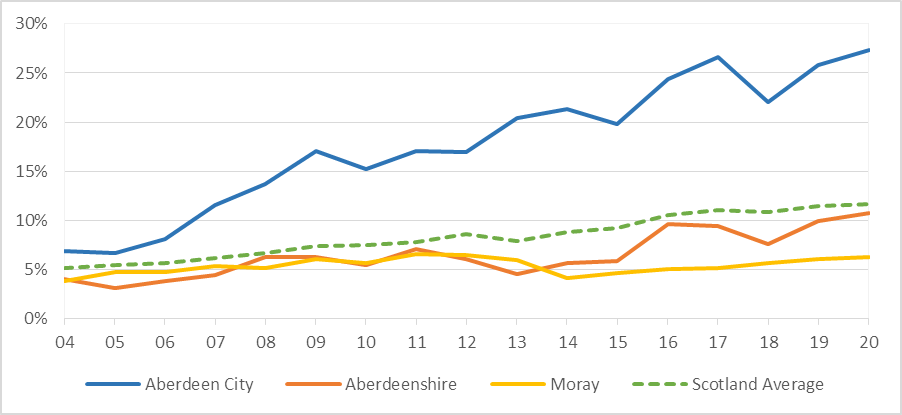
Note: This chart includes ‘white’ people born outside the UK and ‘colour coded’ ethnic minorities.
Data Source: 2020: ONS, Estimated Population by Council Area, Country of Birth and Ethnicity, 2004 to 2020. Link.
Country of Birth
In 2020, Aberdeen City had the highest proportion in Scotland of non-UK born residents: 24%, or 56,000 people, with slightly more than half born in the EU and half outside the EU. For Aberdeenshire and Moray, the figures were 9% (24,000 people) and 5% (5,000 people), with a similar split between EU and non-EU. The Scottish average for 2020 was 9.6%.
Both the proportion of residents born outside of the UK, and the proportion of ethnic minorities has been rising steadily in recent decades, and this has been more pronounced in Aberdeen City, as shown below. While population estimates can be skewed by sample size, the overall trend is clear to see and figures will be confirmed in the 2022 Census. The countries of birth with the highest numbers in Grampian/Scotland in 2011 are also shown below.
Data Source: 2020, NRS, Population by Country of Birth and Nationality in Scotland, by Council Area, 2020. Link.
Percent of Population Born Outside the UK, 2000-2020
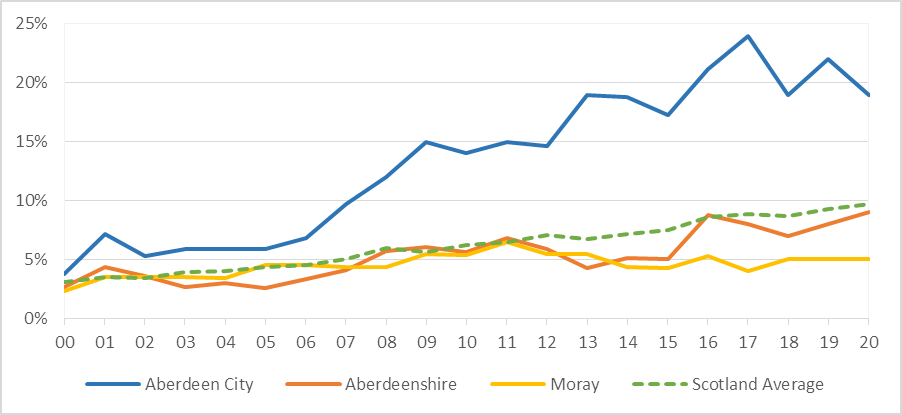
Data Source: 2020: ONS, Estimated Population by Council Area, Country of Birth and Ethnicity, 2004 to 2020. Link.
Top 10 non-UK Countries of Birth, Census 2011
Grampian
| Poland | 10,025 | 1.8% |
| Nigeria | 3,603 | 0.6% |
| Germany | 3,354 | 0.6% |
| India | 3,322 | 0.6% |
| USA | 2,350 | 0.4% |
| Ireland | 2,167 | 0.4% |
| Lithuania | 1,856 | 0.3% |
| Other EU 2001 | 1,816 | 0.3% |
| Other Non-EU | 1,581 | 0.3% |
| Latvia | 1,576 | 0.3% |
Scotland
| Poland | 55,231 | 1% |
| India | 23,489 | 0.4% |
| Ireland | 22,952 | 0.4% |
| Germany | 22,274 | 0.4% |
| Pakistan | 20,039 | 0.4% |
| USA | 15,919 | 0.3% |
| China | 15,338 | 0.3% |
| South Africa | 10,607 | 0.2% |
| Other EU 2001 | 9,782 | 0.2% |
| Nigeria | 9,458 | 0.2% |
Data Source: 2011: Scotland’s Census, Table QS203SC: Country of Birth. Link.
Mothers’ Country of Birth
Between 2007 and 2019, the proportion of births to non-UK born mothers in Aberdeen increased from just under a quarter to just over a third (23% to 36%). During that period, the average in Scotland as a whole increased from 11% to 18%, with figures in Aberdeenshire and Moray slightly lower. Between 2007 and 2012, the number of births increased in Grampian, from 6,108 to 6,470, but this declined in 2017 to 5,917, and again in 2019 to 5,476. There was a similar trend across Scotland, but births to non-UK born mothers continued to increase.
Data Source: 2019, National Records for Scotland, Vital Events Reference Tables (2019, 2017, 2012, 2007), Section 3: Birth. Link.
National Insurance Number Registrations for Overseas Nationals
During the 18-year period from 2002-2020, over 100,000 overseas nationals applied for new National Insurance Numbers (NINO) in Grampian. Annual registration rates varied between a low of 1,496 in 2002 and a high of 8,926 in 2007. As shown in the chart below, figures dropped dramatically in 2016-17, began to rise again in 2018-19, then dropped steeply in 2020. All three council areas in Grampian followed the same trend, with Aberdeen City consistently receiving the largest number of applications, ranging from 1,129 in 2002 to 6,364 in 2014. These figures follow a similar pattern to that seen across the UK, and correlate strongly with international trends, including the entry of 10 countries to the EU in May 2004, the economic downturn of 2008, free movement for Bulgarian and Romanian citizens in January 2014, the Brexit vote of June 2016, and the Covid-19 pandemic in 2020.
Data Source: 2020, Department of Work and Pensions (DWP) statistics. Link.
New National Insurance Number Registrations for Overseas Nationals, 2002-2020
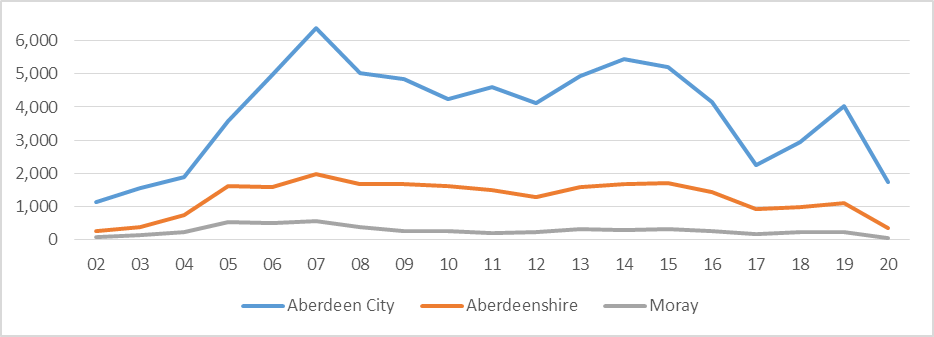
Data Source: 2020: Department of Work and Pensions (DWP) statistics. Link.
Religion
In the 2011 Census, more people in Grampian said they had ‘no religion’ (44.6%) than any specific religious group, and 7.5% did not state a religion. The three Christian categories totalled 45.8% (Church of Scotland 31.6%, Roman Catholic 6.7%, Other Christian 7.5%). The average across Scotland for ‘no religion’ was 36.7%, religion not stated 7%, Church of Scotland 32.4%, Roman Catholic 15.9% and Other Christian 5.5%. While most Church of Scotland members were born in Scotland (93%), nearly half of Grampian’s Roman Catholics were born outside the UK (45.4%), compared with the Scottish average of 12.2%.
In Grampian, people born outside the UK were more likely to identify with a religion: two-thirds versus around half, and the group with the highest proportion identifying with a religion (78.3%) were born in Africa. The figures were similar for Scotland as a whole. Grampian had slightly lower proportions of people who belonged to minority religions (Buddhist, Hindu, Jewish, Muslim, Sikh and Other Religions) than Scotland as a whole (2.1% vs. 2.6%).
Data Source: 2011, Scotland’s Census 2011, Table LC2207SC.