Please click on the place names below for relevant charts and tables.
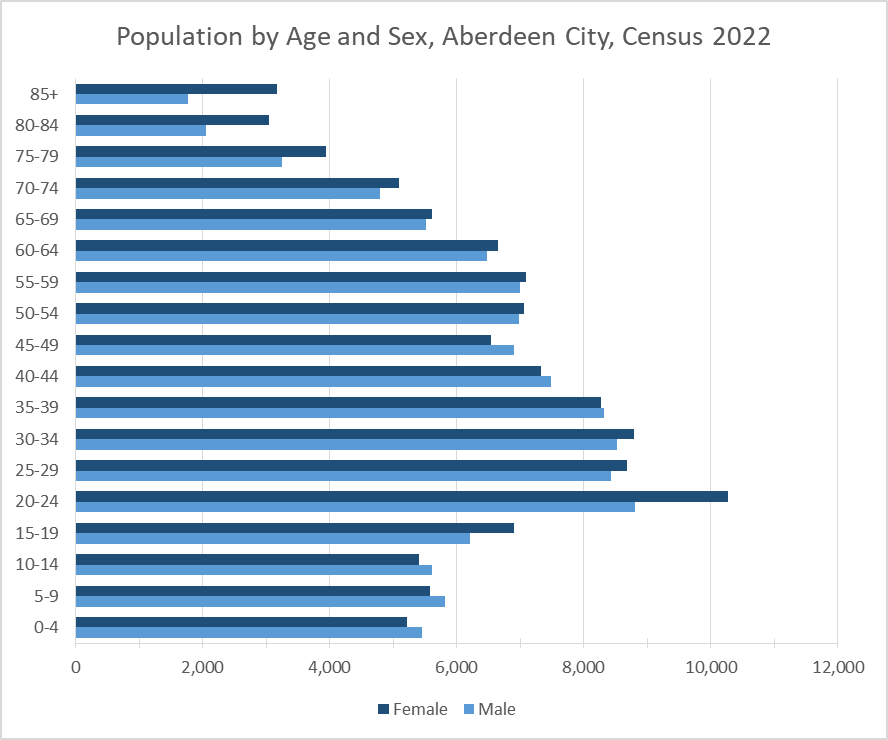
Population by Age and Sex, Aberdeen City, Census 2022
| Age | Total | Female | Male |
|---|---|---|---|
| 0-4 | 10677 | 5218 | 5455 |
| 5-9 | 11378 | 5573 | 5809 |
| 10-14 | 11026 | 5414 | 5611 |
| 15-19 | 13110 | 6899 | 6208 |
| 20-24 | 19086 | 10270 | 8812 |
| 25-29 | 17105 | 8679 | 8423 |
| 30-34 | 17317 | 8785 | 8530 |
| 35-39 | 16599 | 8272 | 8327 |
| 40-44 | 14814 | 7326 | 7492 |
| 45-49 | 13433 | 6538 | 6895 |
| 50-54 | 14039 | 7063 | 6978 |
| 55-59 | 14083 | 7086 | 6997 |
| 60-64 | 13127 | 6657 | 6470 |
| 65-69 | 11129 | 5614 | 5516 |
| 70-74 | 9873 | 5087 | 4788 |
| 75-79 | 7197 | 3946 | 3244 |
| 80-84 | 5095 | 3039 | 2056 |
| 85+ | 4931 | 3170 | 1761 |
| All | 224021 | 114638 | 109383 |
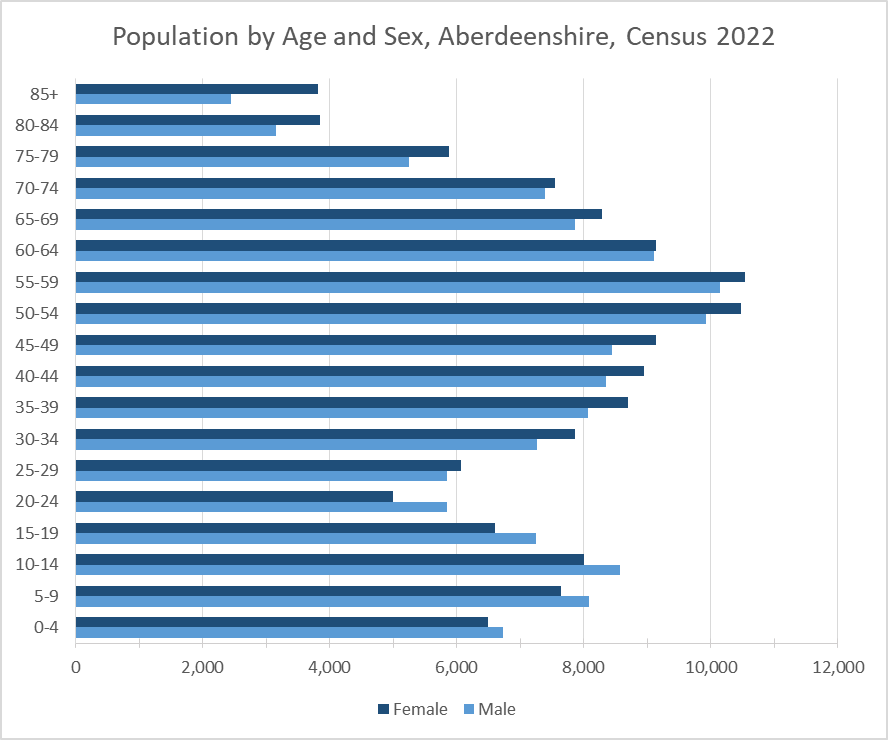
Population by Age and Sex, Aberdeenshire, Census 2022
| Age | Total | Female | Male |
| 0-4 | 13211 | 6487 | 6724 |
| 5-9 | 15737 | 7649 | 8090 |
| 10-14 | 16565 | 7997 | 8568 |
| 15-19 | 13841 | 6597 | 7244 |
| 20-24 | 10848 | 5001 | 5847 |
| 25-29 | 11913 | 6062 | 5851 |
| 30-34 | 15133 | 7866 | 7267 |
| 35-39 | 16757 | 8692 | 8061 |
| 40-44 | 17312 | 8956 | 8356 |
| 45-49 | 17578 | 9132 | 8446 |
| 50-54 | 20395 | 10472 | 9920 |
| 55-59 | 20696 | 10547 | 10149 |
| 60-64 | 18247 | 9135 | 9112 |
| 65-69 | 16156 | 8283 | 7869 |
| 70-74 | 14946 | 7555 | 7394 |
| 75-79 | 11132 | 5877 | 5255 |
| 80-84 | 6994 | 3841 | 3155 |
| 85+ | 6261 | 3816 | 2445 |
| All | 263723 | 133966 | 129757 |
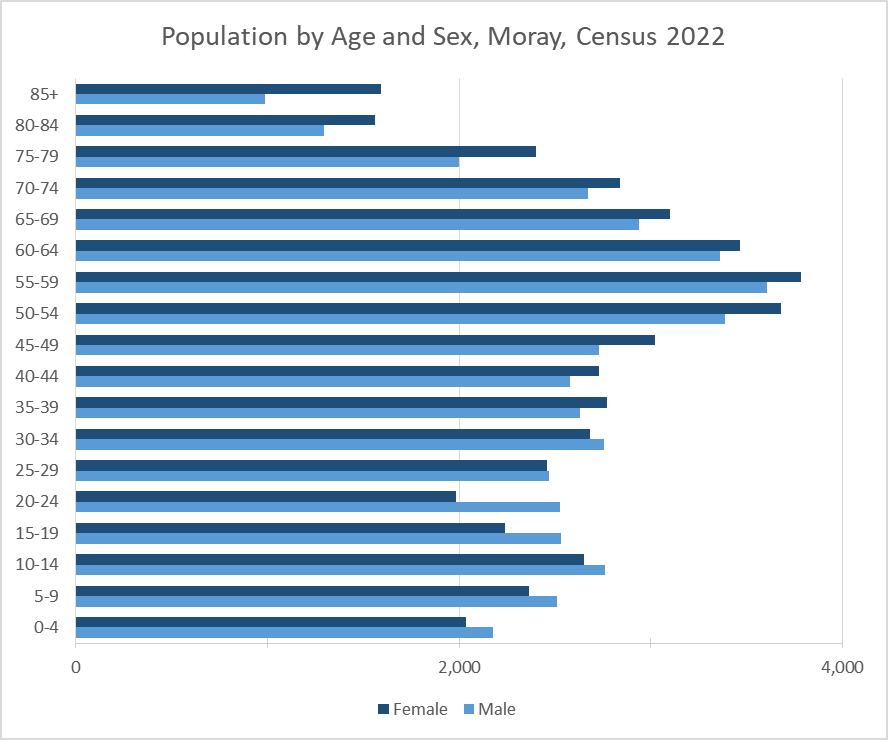
Population by Age and Sex, Moray, Census 2022
| Age | Total | Female | Male |
|---|---|---|---|
| 0-4 | 4213 | 2035 | 2178 |
| 5-9 | 4880 | 2367 | 2513 |
| 10-14 | 5407 | 2651 | 2759 |
| 15-19 | 4771 | 2238 | 2533 |
| 20-24 | 4514 | 1986 | 2529 |
| 25-29 | 4929 | 2457 | 2469 |
| 30-34 | 5438 | 2683 | 2757 |
| 35-39 | 5403 | 2774 | 2629 |
| 40-44 | 5310 | 2729 | 2581 |
| 45-49 | 5745 | 3023 | 2730 |
| 50-54 | 7065 | 3680 | 3385 |
| 55-59 | 7389 | 3784 | 3604 |
| 60-64 | 6826 | 3464 | 3359 |
| 65-69 | 6038 | 3101 | 2937 |
| 70-74 | 5520 | 2842 | 2675 |
| 75-79 | 4402 | 2401 | 2001 |
| 80-84 | 2861 | 1564 | 1297 |
| 85+ | 2585 | 1595 | 990 |
| All | 93293 | 47374 | 45922 |
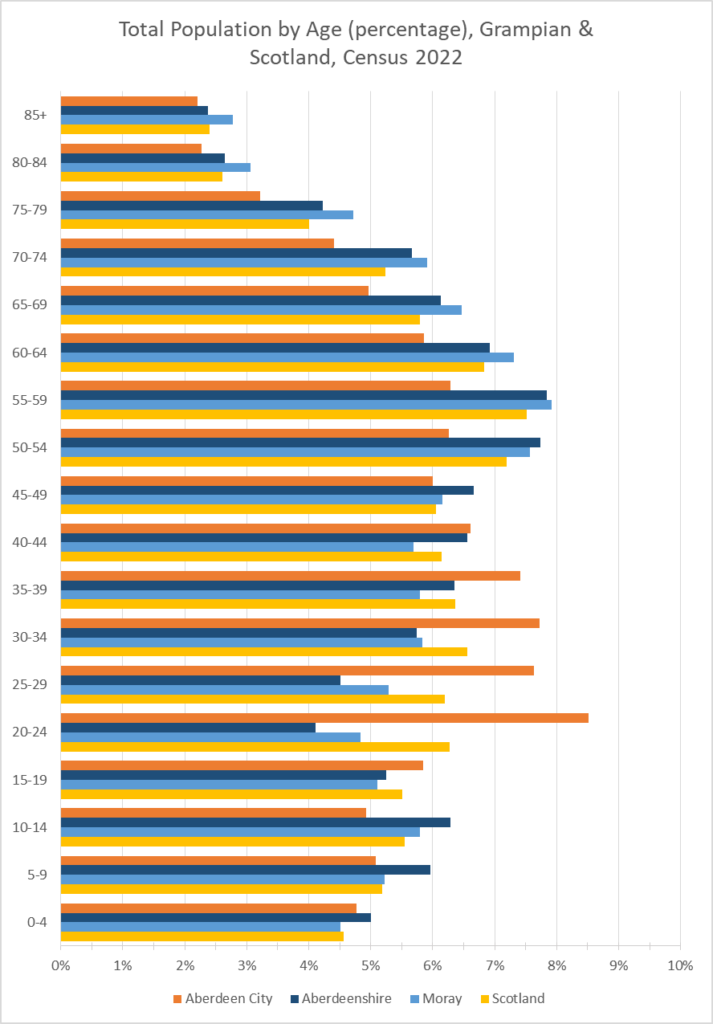
Population by Age (percentage), Grampian & Scotland, Census 2022
| Age | Aberdeen City | Aberdeen shire | Moray | Scotland |
|---|---|---|---|---|
| 0-4 | 4.8% | 5.0% | 4.5% | 4.6% |
| 5-9 | 5.1% | 6.0% | 5.2% | 5.2% |
| 10-14 | 5.0% | 6.3% | 5.8% | 5.6% |
| 15-19 | 5.9% | 5.3% | 5.1% | 5.5% |
| 20-24 | 8.6% | 4.1% | 4.8% | 6.3% |
| 25-29 | 7.6% | 4.5% | 5.3% | 6.2% |
| 30-34 | 7.7% | 5.7% | 5.8% | 6.6% |
| 35-39 | 7.4% | 6.4% | 5.8% | 6.4% |
| 40-44 | 6.6% | 6.6% | 5.7% | 6.1% |
| 45-49 | 6.0% | 6.7% | 6.2% | 6.1% |
| 50-54 | 6.3% | 7.7% | 7.6% | 7.2% |
| 55-59 | 6.3% | 7.9% | 7.9% | 7.5% |
| 60-64 | 5.9% | 6.9% | 7.3% | 6.8% |
| 65-69 | 5.0% | 6.1% | 6.5% | 5.8% |
| 70-74 | 4.4% | 5.7% | 5.9% | 5.2% |
| 75-79 | 3.2% | 4.2% | 4.7% | 4.0% |
| 80-84 | 2.3% | 2.7% | 3.1% | 2.6% |
| 85+ | 2.2% | 2.4% | 2.8% | 2.4% |
Population by Age and Sex, Scotland, Census 2022
| Age | Total | Female | Male |
| 0-4 | 248405 | 120827 | 127586 |
| 5-9 | 282217 | 137324 | 144893 |
| 10-14 | 301831 | 147562 | 154265 |
| 15-19 | 299834 | 146960 | 152876 |
| 20-24 | 341450 | 172710 | 168737 |
| 25-29 | 337411 | 171779 | 165628 |
| 30-34 | 356770 | 182974 | 173793 |
| 35-39 | 346579 | 178135 | 168438 |
| 40-44 | 334198 | 171395 | 162805 |
| 45-49 | 328995 | 168820 | 160175 |
| 50-54 | 391173 | 202204 | 188969 |
| 55-59 | 408667 | 210421 | 198258 |
| 60-64 | 371718 | 191060 | 180659 |
| 65-69 | 315166 | 163219 | 151950 |
| 70-74 | 284759 | 149329 | 135428 |
| 75-79 | 218239 | 118437 | 99803 |
| 80-84 | 142132 | 81844 | 60282 |
| 85+ | 130309 | 82354 | 47955 |
| All | 5439853 | 2797354 | 2642500 |
Data Source: 2022, Census table UV102a. Link.