Please click the tabs to see the data for each local authority, and for Scotland as a whole. Each chart shows the proportion of each ethnic group in different housing categories, and the table below shows the actual figures alongside percentages.
Note: People living rent-free are not shown on the charts because it is such a small proportion (see tables below).
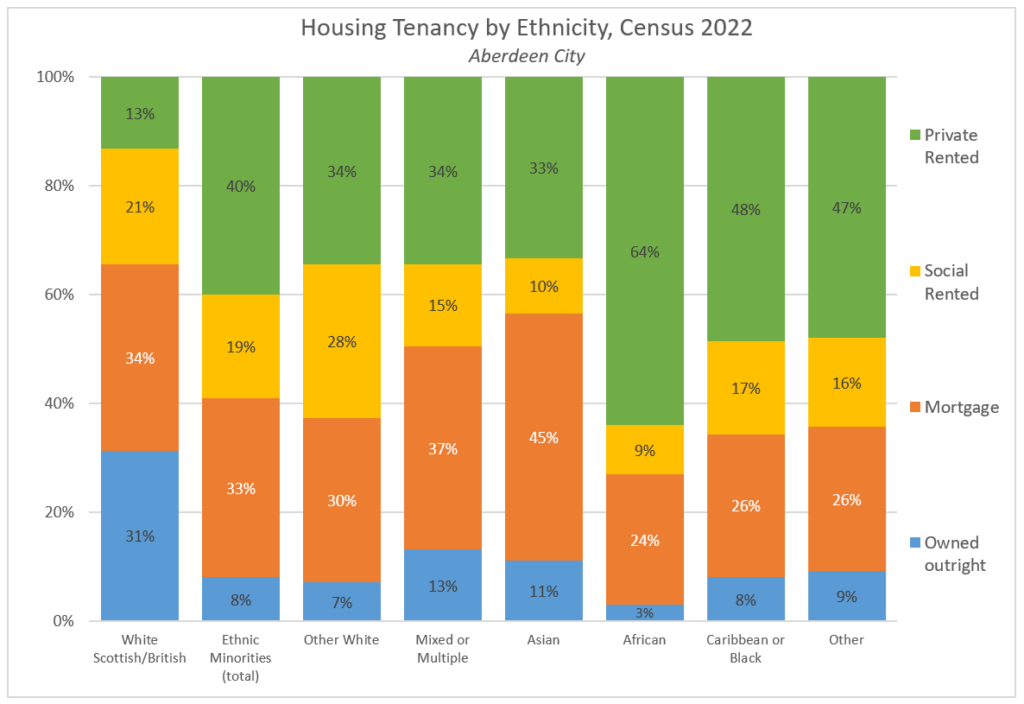
Aberdeen City
Owned Outright
Mortgage
Social Rented
Private Rented
Living Rent Free
Total
White Scot/Brit
50,818
31%
55,794
34%
34,276
21%
20,487
13%
1,762
1.1%
163,136
100%
Ethnic Minorities (total)
4,133
8%
17,174
33%
10,033
19%
20,894
40%
363
0.7%
52,600
100%
Other White
1,688
7%
7,222
30%
6,801
28%
8,330
34%
165
0.7%
24,206
100%
Mixed or Multiple
487
13%
1,391
37%
583
15%
1,294
34%
30
0.8%
3,783
100%
Asian
1,391
11%
5,564
45%
1,281
10%
4,166
33%
94
0.8%
12,496
100%
African
212
3%
1,970
24%
743
9%
5,249
64%
23
0.3%
8,196
100%
Caribbean or Black
39
8%
133
26%
87
17%
245
48%
–
0%
507
100%
Other
319
9%
895
26%
540
16%
1,610
47%
50
1.5%
3,413
100%
All People
54,951
25%
72,968
34%
44,309
21%
41,381
19%
2,125
1%
215,736
100%
Table showing proportion of each ethnic group in each housing category for Aberdeen City, Census 2022.
Aberdeenshire
Owned Outright
Mortgage
Social Rented
Private Rented
Living Rent Free
Total
White Scot/Brit
87,335
36%
101,027
42%
30,386
13%
19,148
8%
3,265
1.4%
241,164
100%
Ethnic Minorities (total)
3,106
15%
9,794
48%
3,347
16%
4,036
20%
271
1.3%
20,553
100%
Other White
1,785
14%
5,751
45%
2,589
20%
2,563
20%
205
1.6%
12,894
100%
Mixed or Multiple
365
18%
1,114
54%
229
11%
335
16%
21
1%
2,064
100%
Asian
651
22%
1,579
54%
222
8%
453
15%
20
0.7%
2,929
100%
African
108
8%
849
65%
93
7%
252
19%
8
0.6%
1,306
100%
Caribbean or Black
37
15%
97
38%
38
15%
80
31%
–
0%
254
100%
Other
160
15%
402
36%
180
16%
349
32%
15
1.4%
1,102
100%
All People
90,441
35%
110,821
42%
33,733
13%
23,184
9%
3,536
1.4%
261,717
100%
Table showing proportion of each ethnic group in each housing category for Aberdeenshire, Census 2022.
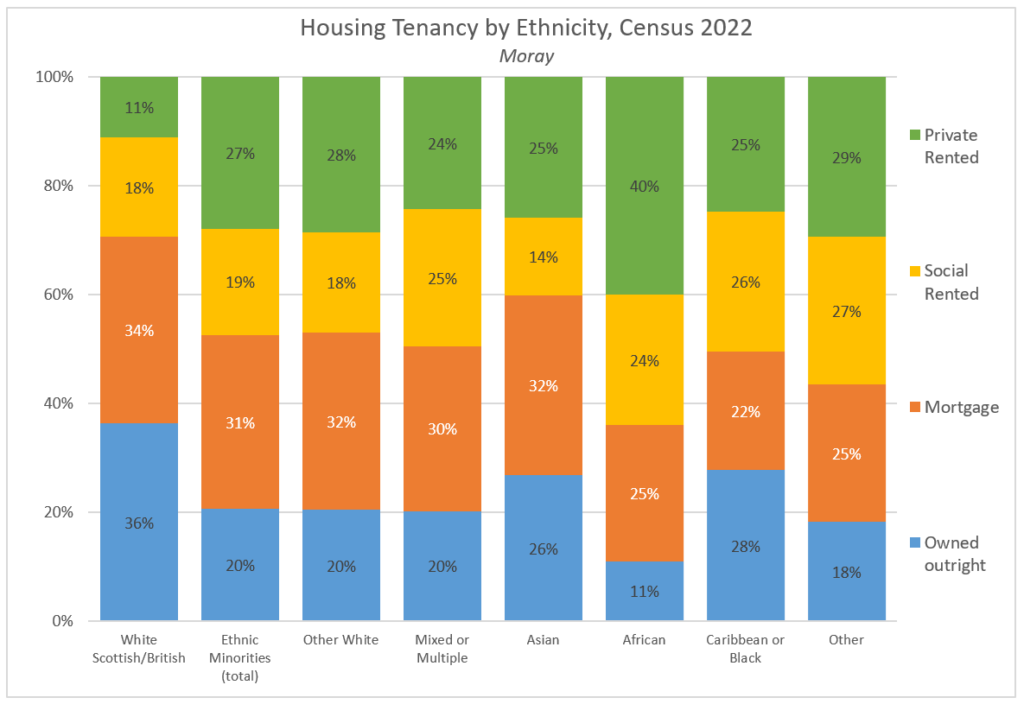
Moray
Owned Outright
Mortgage
Social Rented
Private Rented
Living Rent Free
Total
White Scot/Brit
30,688
36%
29,192
34%
15,176
18%
9,501
11%
1,281
1.5%
85,838
100%
Ethnic Minorities (total)
1,124
20%
1,710
31%
1,057
19%
1,507
27%
113
2.1%
5,511
100%
Other White
671
20%
1,093
32%
622
18%
955
28%
81
2.4%
3,423
100%
Mixed or Multiple
135
20%
198
30%
168
25%
162
24%
7
1%
670
100%
Asian
220
26%
274
32%
118
14%
214
25%
25
2.9%
855
100%
African
14
11%
33
25%
32
24%
53
40%
–
0%
132
100%
Caribbean or Black
27
28%
21
22%
25
26%
24
25%
–
0%
95
100%
Other
61
18%
85
25%
91
27%
99
29%
–
0%
336
100%
All People
31,812
35%
30,902
34%
16,233
18%
11,008
12%
1,394
1.5%
91,349
100%
Table showing proportion of each ethnic group in each housing category for Moray, Census 2022.
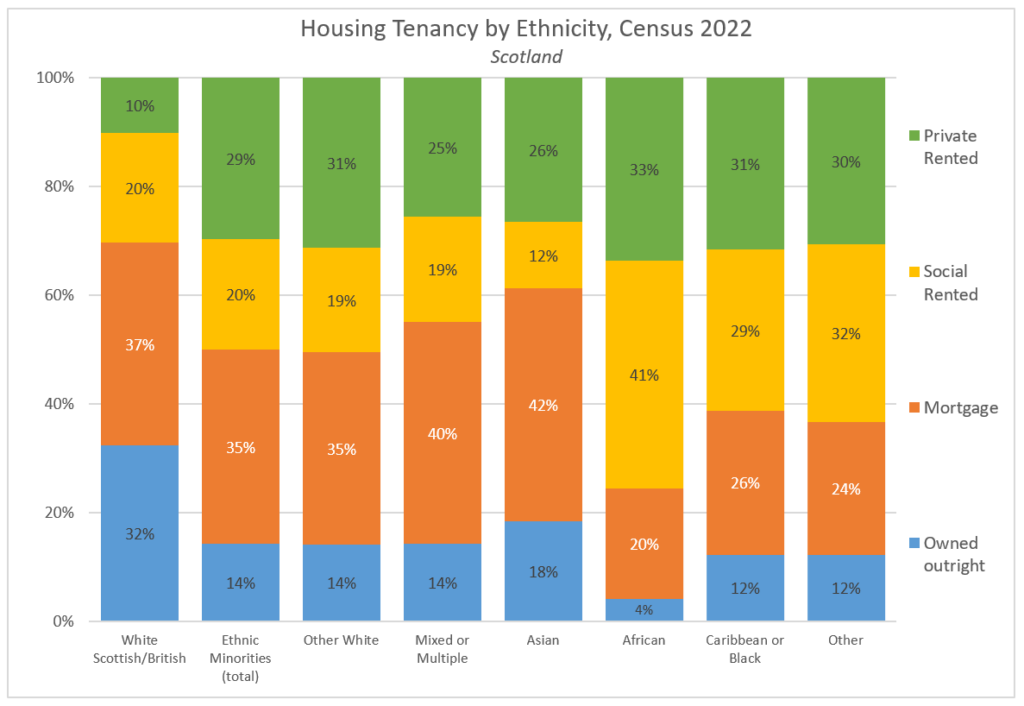
Scotland
Owned Outright
Mortgage
Social Rented
Private Rented
Living Rent Free
Total
White Scot/Brit
1,482,419
32%
1,713,291
37%
949,165
20%
469,334
10%
52,043
1.1%
4,666,252
100%
Ethnic Minorities (total)
94,671
14%
234,470
35%
131,734
20%
194,014
29%
10,629
1.6%
665,513
100%
Other White
41,529
14%
105,635
35%
57,189
19%
94,581
31%
3,420
1.1%
302,354
100%
Mixed or Multiple
8,440
14%
23,531
40%
11,093
19%
14,782
25%
724
1.2%
58,570
100%
Asian
35,951
18%
81,070
42%
23,911
12%
50,387
26%
3,455
1.8%
194,774
100%
African
2,267
4%
11,404
20%
22,813
41%
18,334
33%
1,432
2.5%
56,250
100%
Caribbean or Black
763
12%
1,662
26%
1,885
29%
1,977
31%
157
2.4%
6,447
100%
Other
5,717
12%
11,168
24%
14,845
32%
13,953
30%
1,441
3.1%
47,122
100%
All People
1,577,090
30%
1,947,761
37%
1,080,899
20%
663,348
12%
62,672
1.2%
5,331,765
100%
Table showing proportion of each ethnic group in each housing category for Scotland as a whole, Census 2022.
Data Source: 2022, Census table UV201 and UV403. Link.