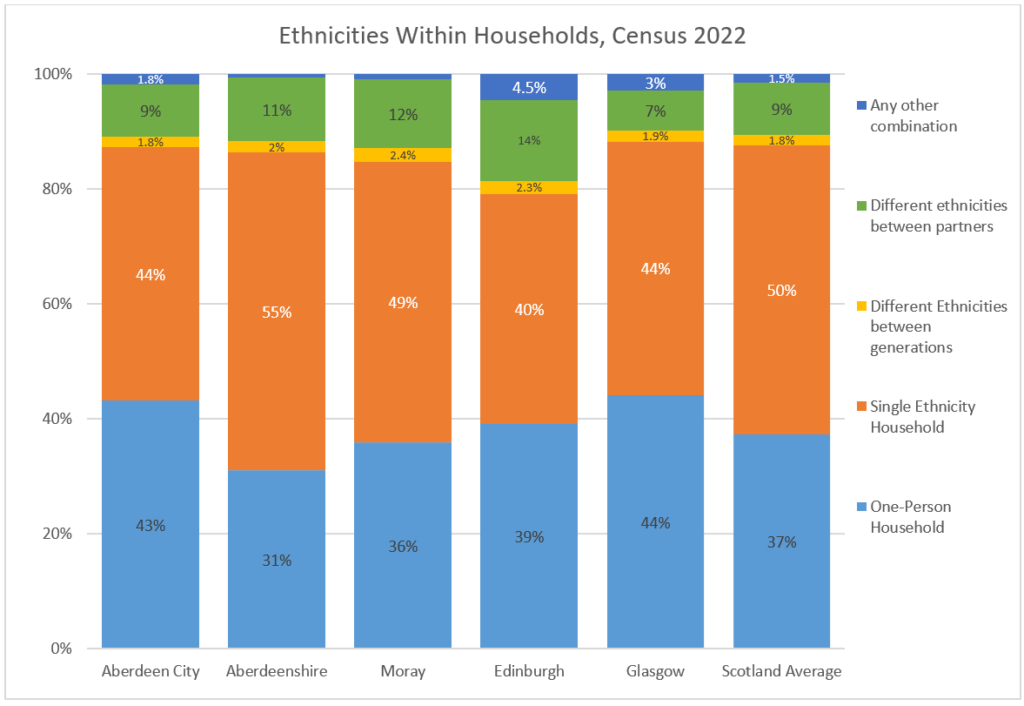
| One-Person Household | Single Ethnicity Household | Different Ethnicities Between Partners | Different Ethnicities Between Generations Only | Any Other Combination | |
| Aberdeen City | 43% | 44% | 9% | 1.8% | 1.8% |
| Aberdeenshire | 31% | 55% | 11% | 2% | 0.6% |
| Moray | 36% | 49% | 12% | 2.4% | 1% |
| Edinburgh | 39% | 40% | 14% | 2.3% | 4.5% |
| Glasgow | 44% | 44% | 7% | 1.9% | 3% |
| Scotland Average | 37% | 50% | 9% | 1.8% | 1.5% |
Data Source: 2022, Census table UV203. Link.