Please click on the place names below for relevant charts and tables for people aged 16+. Or, scroll down for Scotland-wide data for people aged 25+.
Highest Level of Education by Country of Birth,
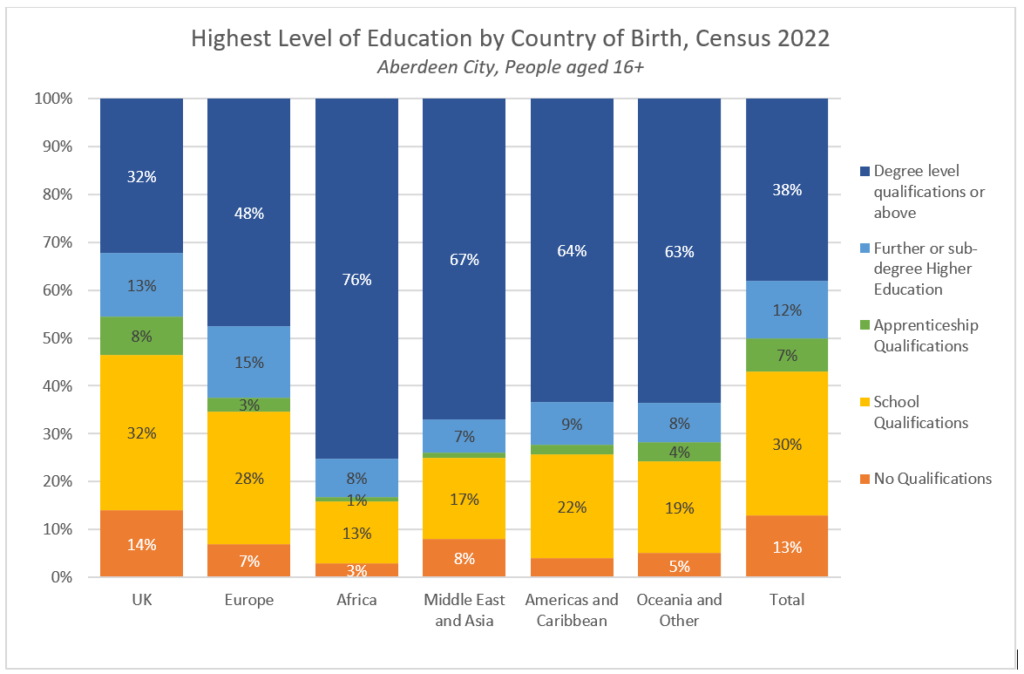
people aged 16+ in Aberdeen City, Census 2022
| Country of Birth (region) | No Quals | School Quals* | Apprentice-ship | Further or sub-degree Higher Education | Degree or Above | Total (aged 16+) |
|---|---|---|---|---|---|---|
| UK | 14% 21,053 | 32% 47,390 | 8% 12,309 | 13% 18,805 | 32% 47,344 | 146,901 |
| Europe (excl. UK) | 7% 1,433 | 28% 5,658 | 3% 539 | 15% 3,110 | 48% 9,768 | 20,508 |
| Africa | 3% 191 | 13% 925 | 1% 94 | 8% 585 | 76% 5,580 | 7,375 |
| Middle East and Asia | 8% 826 | 17% 1,809 | 1% 123 | 7% 724 | 67% 6,929 | 10,411 |
| Americas and Caribbean | 4% 126 | 22% 677 | 2% 55 | 9% 275 | 64% 2,013 | 3,146 |
| Oceania and Other | 5% 23 | 19% 93 | 4% 21 | 8% 39 | 63% 307 | 483 |
| Total | 13% 23,657 | 30% 56,553 | 7% 13,139 | 12% 23,538 | 38% 71,942 | 188,829 |
Highest Level of Education by Country of Birth,
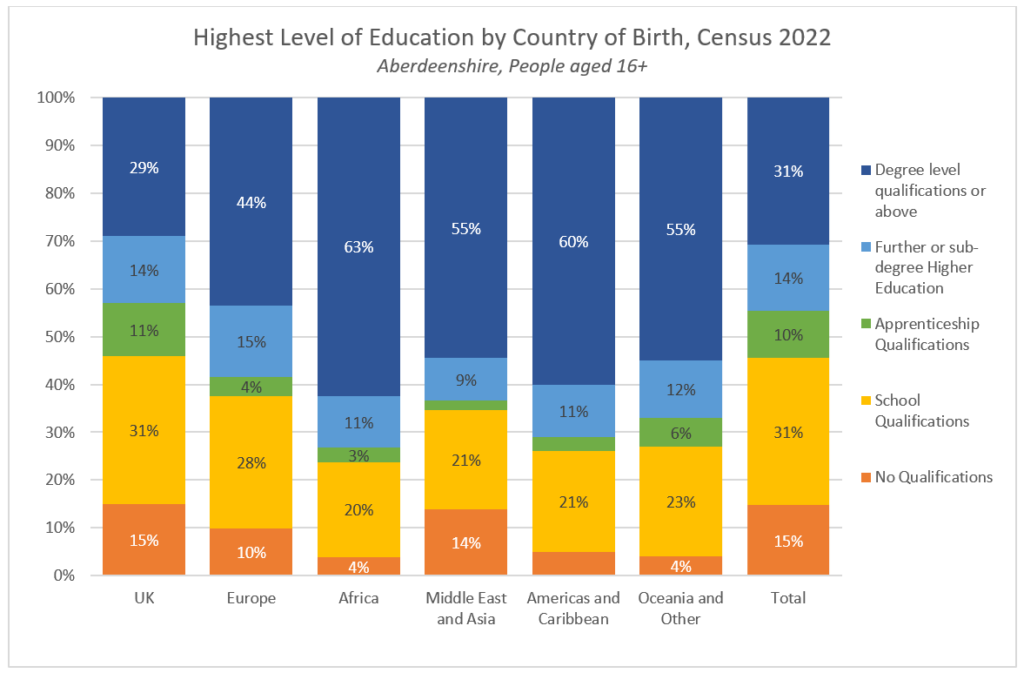
people aged 16+ in Aberdeenshire, Census 2022
| Country of Birth (region) | No Quals | School Quals* | Apprentice-ship | Further or sub-degree Higher Education | Degree or Above | Total (aged 16+) |
|---|---|---|---|---|---|---|
| UK | 15% 29,843 | 31% 61,742 | 11% 20,932 | 14% 26,942 | 29% 58,322 | 197,781 |
| Europe (excl. UK) | 10% 960 | 28% 2,795 | 4% 393 | 15% 1,528 | 44% 4,405 | 10,081 |
| Africa | 4% 82 | 20% 409 | 3% 58 | 11% 227 | 63% 1,290 | 2,066 |
| Middle East and Asia | 14% 394 | 21% 598 | 2% 60 | 9% 259 | 55% 1,579 | 2,890 |
| Americas and Caribbean | 5% 86 | 21% 345 | 3% 46 | 11% 180 | 60% 1,002 | 1,659 |
| Oceania and Other | 4% 22 | 23% 124 | 6% 34 | 12% 64 | 55% 301 | 545 |
| Total | 15% 31,387 | 31% 66,003 | 10% 21,531 | 14% 29,199 | 31% 66,900 | 215,022 |
Highest Level of Education by Country of Birth,
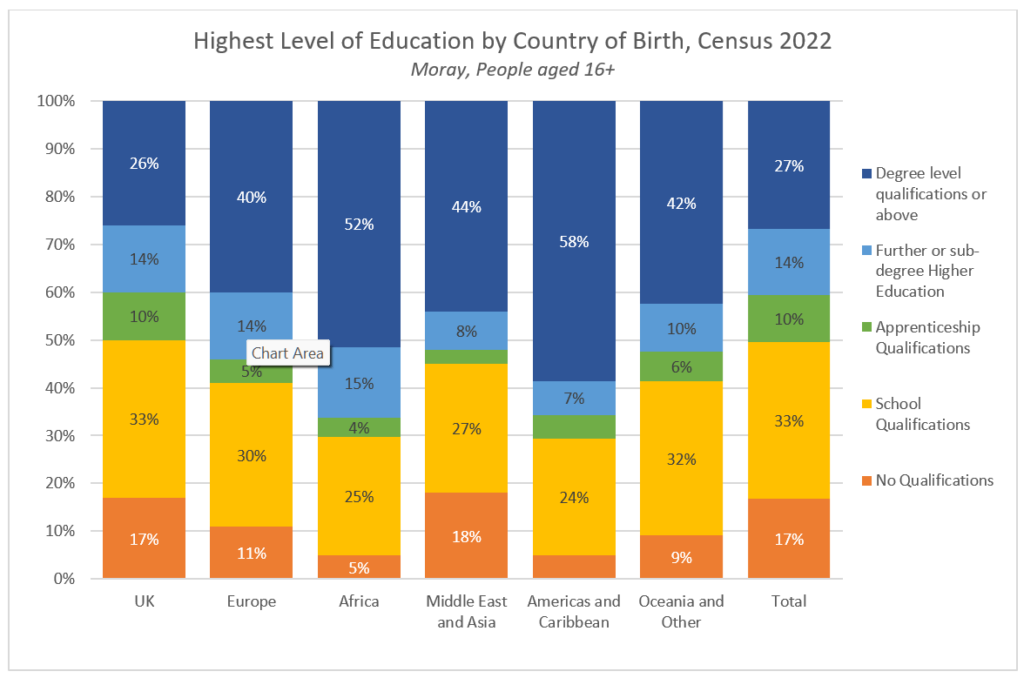
people aged 16+ in Moray, Census 2022
| Country of Birth (region) | No Quals | School Quals* | Apprentice-ship | Further or sub-degree Higher Education | Degree or Above | Total (aged 16+) |
|---|---|---|---|---|---|---|
| UK | 17% 12,392 | 33% 23,852 | 10% 7,522 | 14% 10,011 | 26% 18,534 | 72,311 |
| Europe (excl. UK) | 11% 358 | 30% 949 | 5% 150 | 14% 450 | 40% 1,266 | 3,173 |
| Africa | 5% 27 | 25% 144 | 4% 22 | 15% 83 | 52% 293 | 569 |
| Middle East and Asia | 18% 160 | 27% 240 | 3% 29 | 8% 74 | 44% 393 | 896 |
| Americas and Caribbean | 5% 33 | 24% 145 | 5% 29 | 7% 43 | 58% 351 | 601 |
| Oceania and Other | 9% 18 | 32% 68 | 6% 12 | 10% 20 | 42% 88 | 206 |
| Total | 17% 12,993 | 33% 25,393 | 10% 7,762 | 14% 10,680 | 27% 20,922 | 77,750 |
Highest Level of Education by Country of Birth,
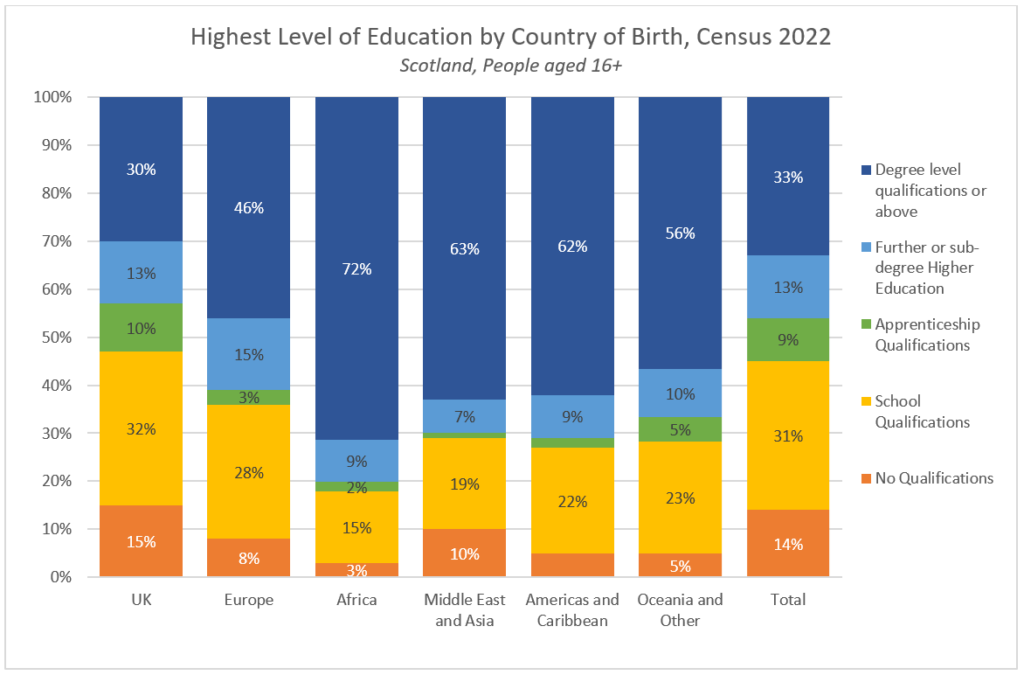
people aged 16+ in Scotland, Census 2022
| Country of Birth (region) | No Quals | School Quals* | Apprentice-ship | Further or sub-degree Higher Education | Degree or Above | Total (aged 16+) |
|---|---|---|---|---|---|---|
| UK | 15% 63,292 | 32% 132,984 | 10% 40,771 | 13% 55,757 | 30% 124,199 | 417,003 |
| Europe (excl. UK) | 8% 2,761 | 28% 9,396 | 3% 1,080 | 15% 5,090 | 46% 15,434 | 33,761 |
| Africa | 3% 303 | 15% 1,478 | 2% 174 | 9% 895 | 72% 7,162 | 10,012 |
| Middle East and Asia | 10% 1,380 | 19% 2,639 | 1% 211 | 7% 1,056 | 63% 8,901 | 14,187 |
| Americas and Caribbean | 5% 244 | 22% 1,167 | 2% 134 | 9% 500 | 62% 3,366 | 5,411 |
| Oceania and Other | 5% 63 | 23% 290 | 5% 67 | 10% 124 | 56% 697 | 1,241 |
| Total | 14% 68,035 | 31% 147,955 | 9% 42,432 | 13% 63,417 | 33% 159,763 | 481,602 |
Please note, the figures above are for all people aged 16 or older, even though many apprenticeships, further education courses and degrees are not completed until age 18-22. Unfortunately, relevant data is not available by age and country of birth for different local authorities, though this data is available for age and ethnicity (see the charts and tables here). However, the data for Scotland as a whole (below) is interesting. While the percentage of people with degrees increases in most groups, it decreases slightly for those born in Africa, the Middle East and Asia, possibly because many people from those areas are living in Scotland . This might indicate that a large proportion of
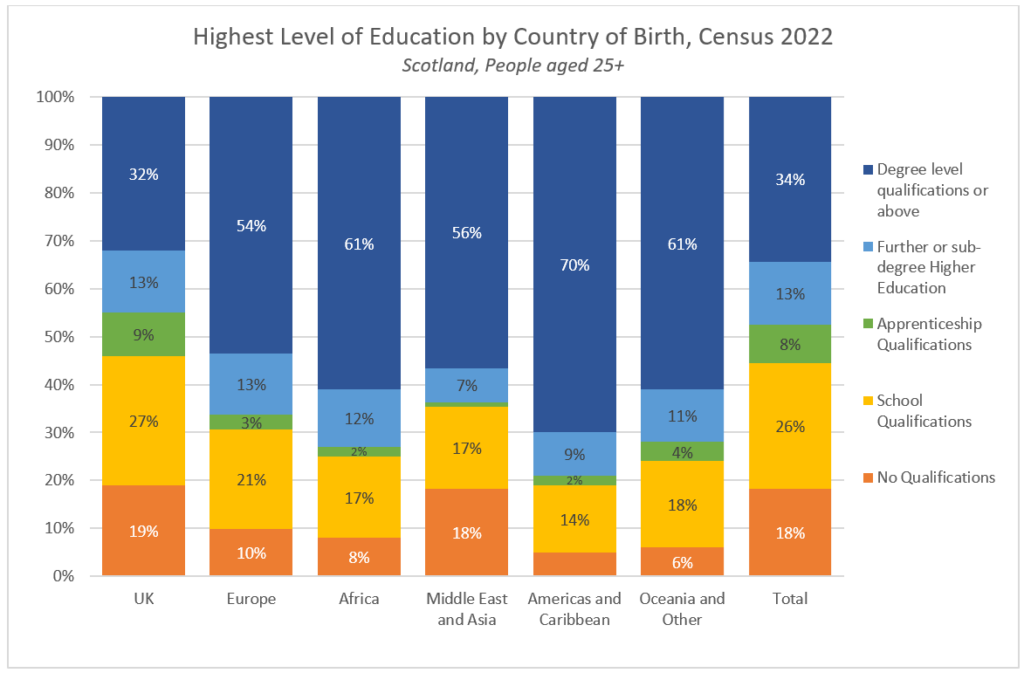
Highest Level of Education by Country of Birth,
people aged 25+ in Scotland, Census 2022
| Country of Birth (region) | No Quals | School Quals* | Apprentice-ship | Further or sub-degree Higher Education | Degree or Above | Total (aged 25+) |
|---|---|---|---|---|---|---|
| UK | 19% 675,566 | 27% 969,251 | 9% 309,088 | 13% 466,233 | 32% 1,125,631 | 3,545,769 (89%) |
| Europe (excl. UK) | 10% 19,164 | 21% 40,589 | 3% 5,832 | 13% 26,226 | 54% 105,657 | 197,468 (5%) |
| Africa | 8% 4,391 | 17% 10,037 | 2% 1,342 | 12% 6,848 | 61% 34,824 | 57,442 (1%) |
| Middle East and Asia | 18% 21,694 | 17% 20,694 | 1% 1,666 | 7% 8,596 | 56% 65,856 | 118,506 (3%) |
| Americas and Caribbean | 5% 1,886 | 14% 4,921 | 2% 698 | 9% 3,116 | 70% 25,189 | 35,810 (0.9%) |
| Oceania and Other | 6% 634 | 18% 2,037 | 4% 483 | 11% 1,208 | 61% 6,727 | 11,089 (0.3%) |
| Total (aged 25+) | 18% 723,335 | 26% 1,047,529 | 8% 319,109 | 13% 512,227 | 34% 1,363,884 | 3,966,084 |
Data Source: 2022, Census tables UV501 and UV204b. Link.