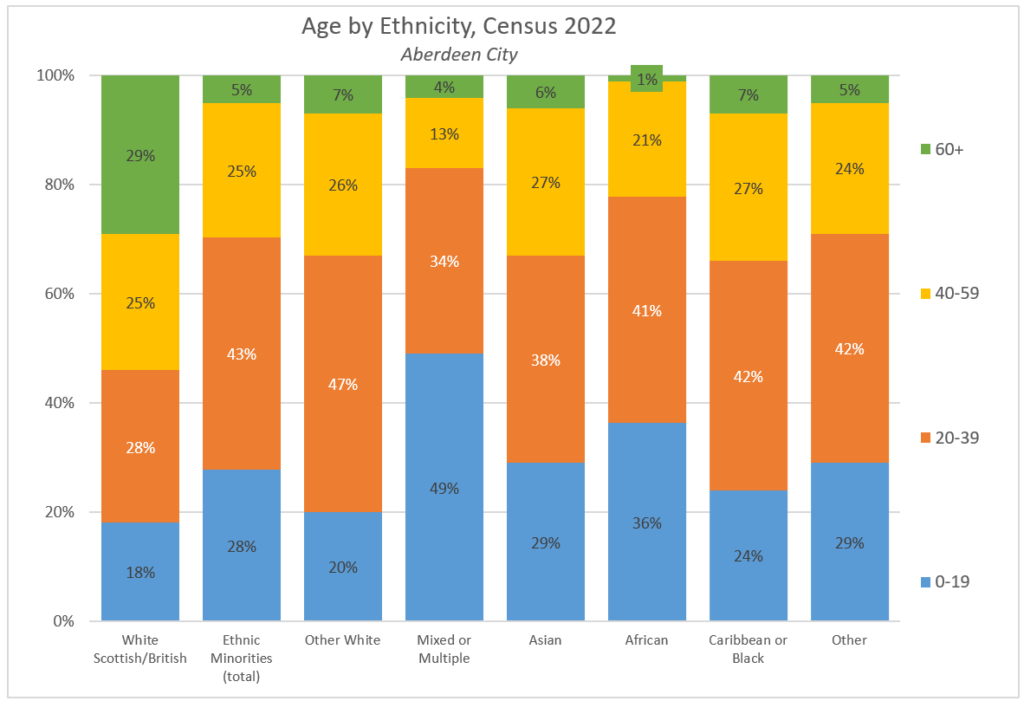
Please click the tabs to see the data for each local authority, and for Scotland as a whole. Each chart shows the age spread for each ethnic group, and the table below shows the actual figures alongside percentages.
Aberdeen City
0-19
20-39
40-59
60+
Total
White Scot/Brit
30,870
18%
46,496
28%
42,703
25%
48,452
29%
168,521
100%
Ethnic Minorities (total)
15,321
28%
23,611
43%
13,666
25%
2,900
5%
55,498
100%
Other White
5,151
20%
11,861
47%
6,695
26%
1,691
7%
25,398
100%
Mixed or Multiple
1,965
49%
1,372
34%
509
13%
150
4%
3,996
100%
Asian
3,825
29%
4,976
38%
3,554
27%
721
6%
13,076
100%
African
3,187
36%
3,656
41%
1,901
21%
127
1%
8,871
100%
Caribbean or Black
131
24%
232
42%
149
27%
38
7%
550
100%
Other
1,058
29%
1,509
42%
864
24%
162
5%
3,593
100%
All People
46,191
21%
70,107
31%
56,369
25%
51,352
23%
224,019
100%
Table showing the proportion of each ethnic group falling into each age category, for Aberdeen City, Census 2022.
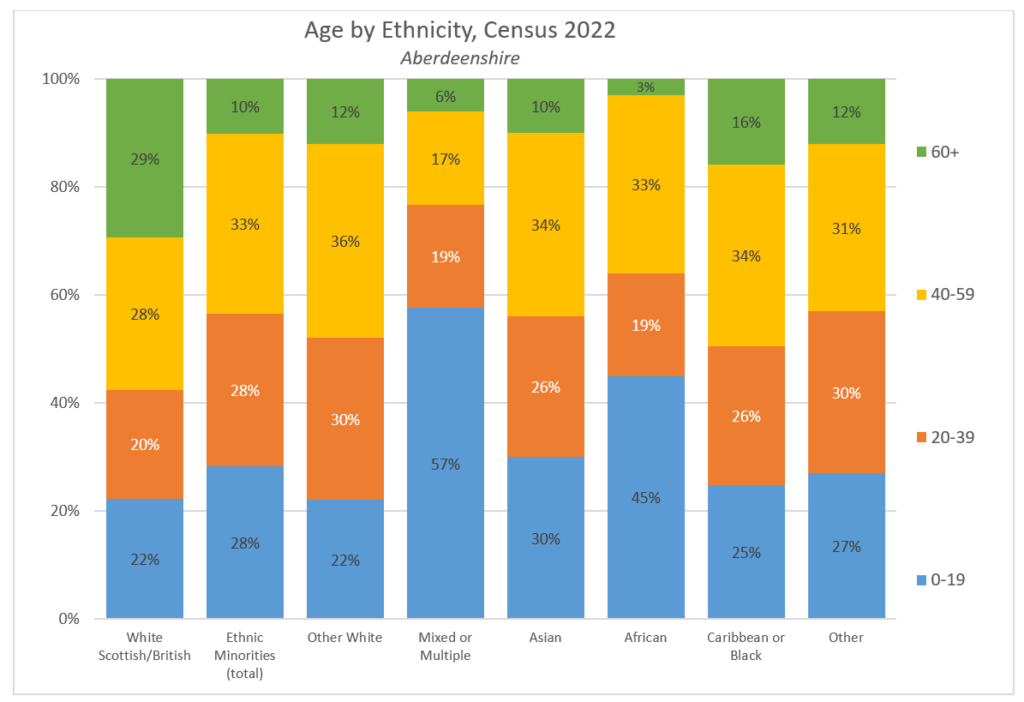
Aberdeenshire
0-19
20-39
40-59
60+
Total
White Scot/Brit
53,500
22%
48,924
20%
69,059
28%
71,571
29%
243,054
100%
Ethnic Minorities (total)
5,854
28%
5,727
28%
6,922
33%
2,165
10%
20,668
100%
Other White
2,818
22%
3,922
30%
4,722
36%
1,511
12%
12,973
100%
Mixed or Multiple
1,187
57%
394
19%
353
17%
134
6%
2,068
100%
Asian
892
30%
754
26%
996
34%
297
10%
2,939
100%
African
597
45%
252
19%
432
33%
38
3%
1,319
100%
Caribbean or Black
62
25%
65
26%
85
34%
39
16%
251
100%
Other
301
27%
338
30%
340
31%
130
12%
1,109
100%
All People
59,354
23%
54,651
21%
75,981
29%
73,736
28%
263,722
100%
Table showing the proportion of each ethnic group falling into each age category, for Aberdeenshire, Census 2022.
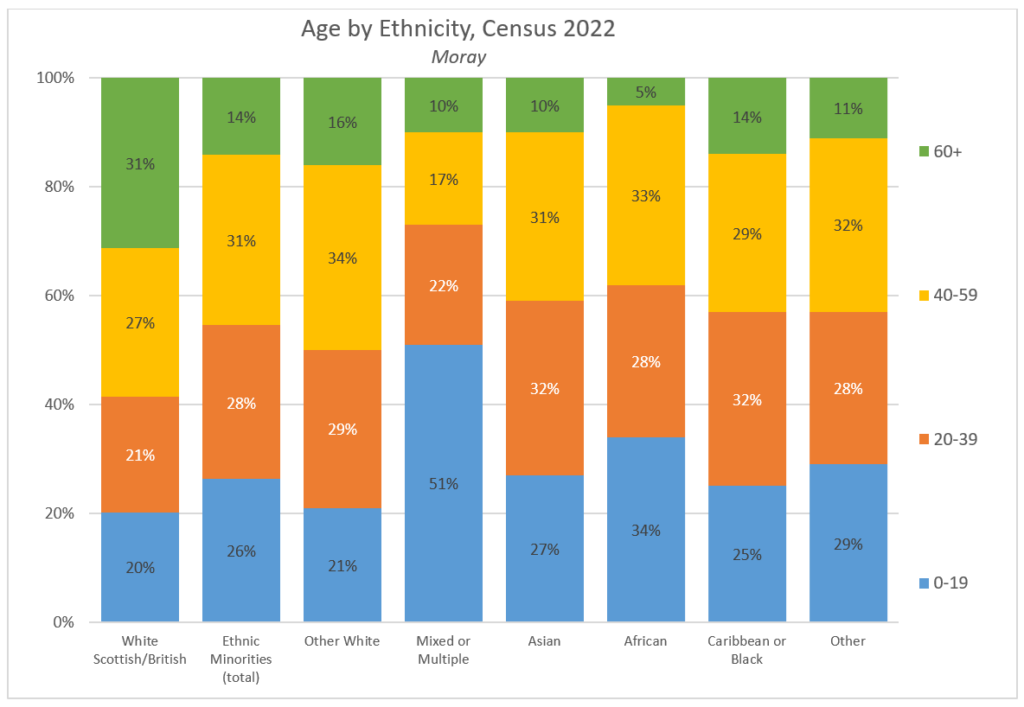
Moray
0-19
20-39
40-59
60+
Total
White Scot/Brit
17,735
20%
18,622
21%
23,694
27%
27,408
31%
87,459
100%
Ethnic Minorities (total)
1,536
26%
1,662
28%
1,815
31%
824
14%
5,837
100%
Other White
743
21%
1,029
29%
1,234
34%
592
16%
3,598
100%
Mixed or Multiple
361
51%
155
22%
117
17%
69
10%
702
100%
Asian
244
27%
292
32%
276
31%
90
10%
902
100%
African
52
34%
43
28%
51
33%
8
5%
154
100%
Caribbean or Black
28
25%
36
32%
32
29%
15
14%
111
100%
Other
101
29%
97
28%
113
32%
40
11%
351
100%
All People
19,271
21%
20,284
22%
25,509
27%
28,232
30%
93,296
100%
Table showing the proportion of each ethnic group falling into each age category, for Moray, Census 2022.
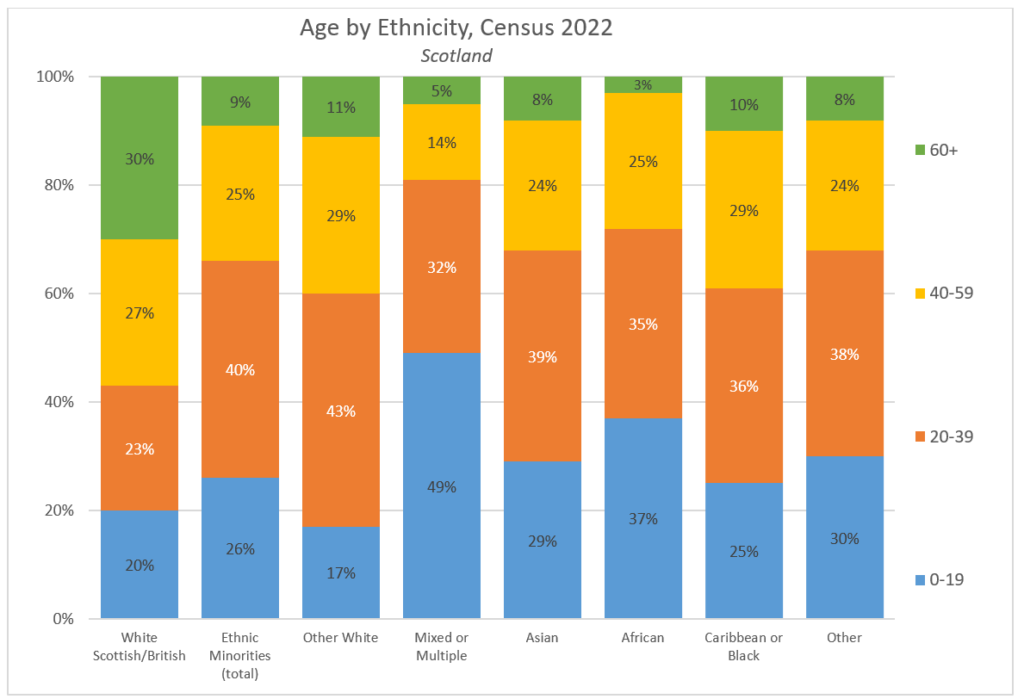
Scotland
0-19
20-39
40-59
60+
Total
White Scot/Brit
947,766
20%
1,103,753
23%
1,285,229
27%
1,400,572
30%
4,737,320
100%
Ethnic Minorities (total)
184,518
26%
278,449
40%
177,802
25%
61,752
9%
702,521
100%
Other White
54,754
17%
133,895
43%
90,272
29%
35,640
11%
314,561
100%
Mixed or Multiple
29,776
49%
19,419
32%
8,746
14%
2,960
5%
60,901
100%
Asian
61,802
29%
83,063
39%
50,440
24%
16,710
8%
212,015
100%
African
21,773
37%
20,588
35%
14,600
25%
1,678
3%
58,639
100%
Caribbean or Black
1,717
25%
2,442
36%
1,935
29%
687
10%
6,781
100%
Other
14,697
30%
19,059
38%
11,802
24%
4,071
8%
49,629
100%
All People
1,132,284
21%
1,382,202
25%
1,463,031
27%
1,462,324
27%
5,439,841
100%
Table showing the proportion of each ethnic group falling into each age category, for Scotland as a whole, Census 2022.
Data Source: 2022, Census table UV201 and UV102. Link.